
Client background
A California credit union worked with ConversionTeam on a January-May 2026 optimization program. The work covered its public website and the opening step of its online account application. The 11 experiments belonged to eight test groups, including followup tests of earlier ideas.
The challenge
The credit union wanted more visitors to progress from learning about membership to completing an application. Those are different decisions. Homepage messaging could encourage someone to start, while application instructions could affect whether they continued.
Objectives
- Test how application instructions affected completed applications.
- Make membership benefits and the next step easier to understand.
- Compare application starts with completed applications, saves and resumes.
- Use unsuccessful tests to decide what to revise or leave unchanged.
Our solution
We tested specific changes against the existing experience, reviewed the results, and followed up on selected ideas. The program included an application-opening redesign, homepage messaging and navigation changes. Visitor feedback and funnel analysis also informed further application-flow work.
Testing ran from January 28 through May 20. A winning decision describes the outcome recorded for that experiment and its selected metric. It does not establish that every change was permanently implemented or that a completed application became an approved or funded account.
Program highlights
- Application expectations and requirements.
- Homepage value propositions, benefits and member testimonials.
- Product benefit tiles and calls to action.
- Font size and menu navigation.
The three featured experiments below illustrate the program. All 11 experiments, including the nonwins, appear in the full results.
Featured experiment 1 of 3
Explain what applicants need before they begin
Background and hypothesis
The original opening emphasized the account offer and a mobile-device requirement, with more information under Learn More. We tested whether a clearer time expectation and visible requirements checklist would help applicants continue.
What visitors saw
The variation led with “Open your account in just 5 minutes” and organized the required information into a checklist. The Learn More section remained available. The five-minute wording was part of the tested message; the experiment did not measure a five-minute completion time.
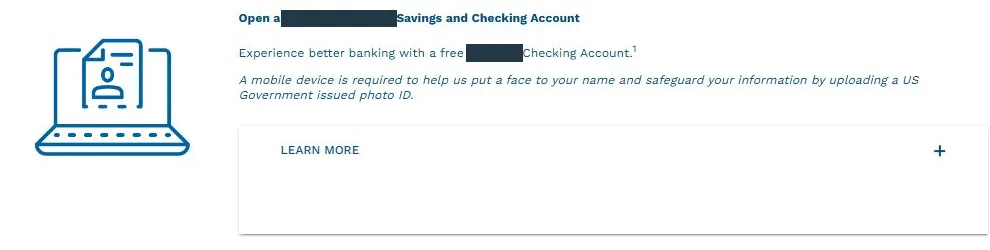
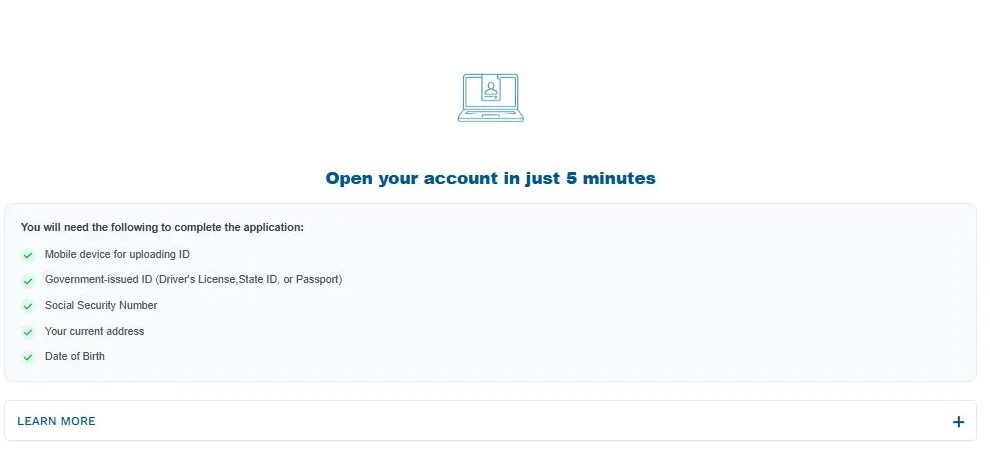
Authentic desktop captures. Identifying text is masked. The variation reorganized the existing requirements and kept the ID requirement.
Results
Completed applications per exposed user rose from 13.08% to 15.91%, a 21.61% relative increase. Saved applications per user rose from 1.79% to 2.80%.
The save result came from only 26 recorded events. Saving an application does not establish that it was later completed, approved or activated. Event wiring was not independently inspected. Application starts were effectively unchanged.
Featured experiment 2 of 3
Add member stories between account opening and search
Background and hypothesis
On the original homepage, site search followed the account-opening section. We tested a member-testimonial carousel between those sections. The hypothesis was that visitors considering membership could benefit from other members' experiences before continuing.
What visitors saw
The Open an Account button stayed in place. Below it, the variation added a blue Member Story carousel with a testimonial, member name, star rating and arrows. Site search followed the carousel. The application form was unchanged.
Control: original page order
- Account-opening section with the Open an Account button.
- Site search.
Variation: member stories added
- Account-opening section with the Open an Account button.
- New member-testimonial carousel.
- Site search.
Simplified layout diagram, not a screenshot. The authentic mobile captures below show the added carousel in this position.
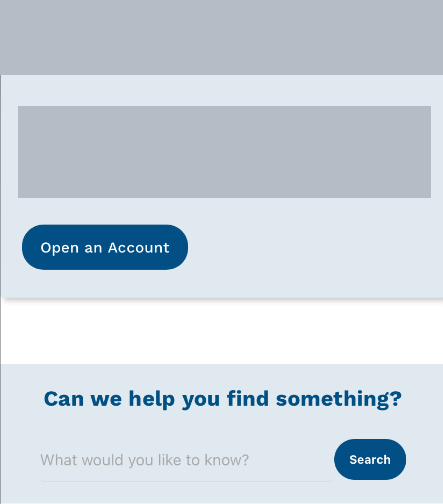
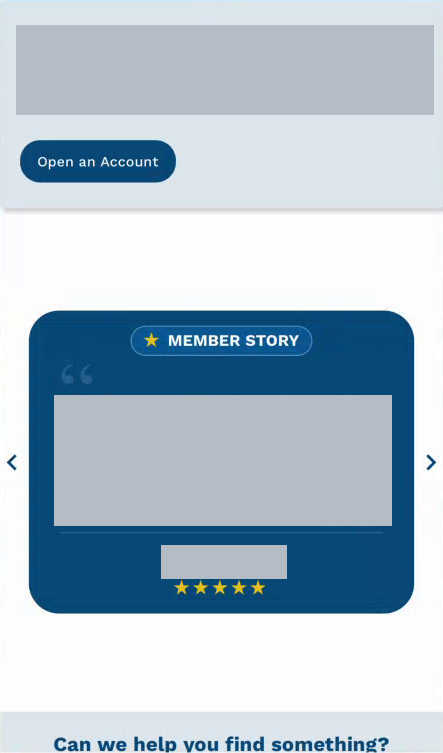
Gray masks hide identifying content. The captures have different heights. The experiment ran on desktop and mobile.
Results
Completed applications per homepage user rose from 0.92% to 1.05%, a 13.97% relative increase. Among returning visitors, application resumes rose from 0.22% to 0.42%.
The returning-visitor result was selected after reviewing existing outcomes; it was not a planned subgroup hypothesis. Its reported confidence is unadjusted for that selection. The overall results were mixed: overall application resumes +4.86% and starts -2.94%. New-visitor resumes declined. The selected result does not describe all visitors or establish more funded accounts.
The experiment measured application events, not trust or whether people who read a testimonial individually became more likely to finish.
Featured experiment 3 of 3
Turn homepage benefits into tiles with a direct next step
Background and hypothesis
An earlier homepage-benefits experiment underperformed. The followup tested whether a more visible benefit layout and a direct account-opening button would help visitors act on the offer.
What visitors saw
The control used a bullet list and a Learn More button. The variation arranged the benefits in six tiles with orange icons. Open an Account became the primary button, with Learn More beside it as a text link.
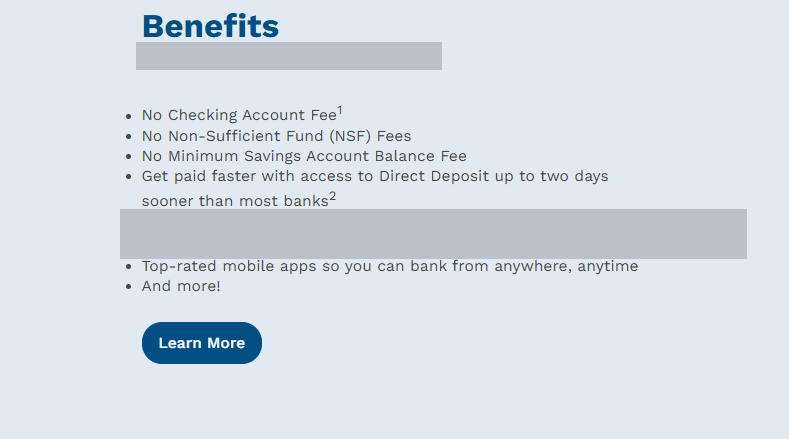
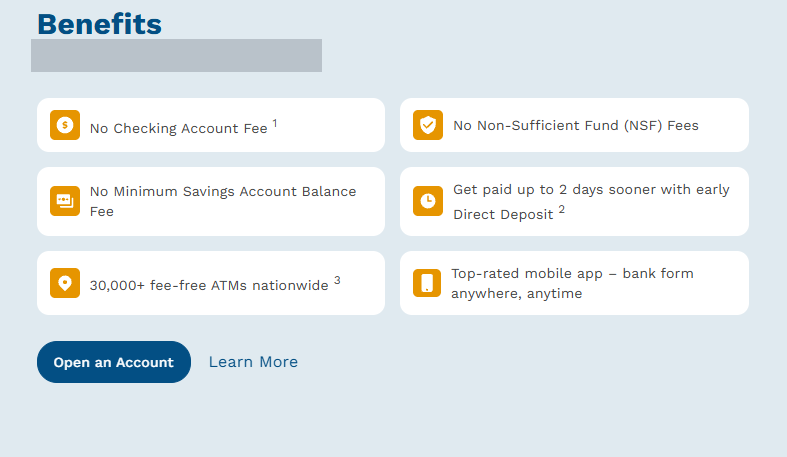
Authentic desktop crops. Identifying details are masked. The comparison preserves the original benefit layout and complete calls to action.
Results
Completed applications per user rose from 1.18% to 1.25%, an observed 6.52% relative increase. The program recorded a winning decision, but the estimate was uncertain and does not establish a dependable gain.
Other application outcomes were mixed: application resumes -21.63%, from 42 recorded events to 33, while saves remained at 13 in each version. These comparisons are uncertain too. The result supports further attention to the benefits presentation, with the limits shown in the appendix.
Full program results
Six of the 11 experiments received winning decisions. Four used completed applications as the decision metric; two used application starts. One experiment was inconclusive and four others were nonwins. Followups count as separate experiments, while the eight groups describe the ideas tested.
The table includes every experiment in this program. Each percentage is a relative change for its named event and tested audience. They cannot be added into a program-wide lift.
| Experiment | Recorded outcome | Result and context |
|---|---|---|
| Homepage value proposition | Nonwin | Selected variation underperformed on completed applications; the test was stopped. |
| Application-opening expectations | Winning decision | Completed applications +21.61%. Featured above. |
| Homepage social-proof widget | Winning decision on starts | Application starts +7.54%; completed applications -1.40%. Completion was uncertain and did not show an improvement. The selected version retained achievements, removed Local Favorites on desktop, and used an application CTA. |
| Product benefit tiles with a CTA | Winning decision on starts | Application starts +7.12%; completed applications -0.52%. Completion was uncertain and did not show an improvement. Permanent implementation was pending accessibility review. |
| Homepage value-proposition followup | Nonwin | The followup was not selected as a winner. |
| Font size | Inconclusive | The stopping decision was inconclusive; a followup tested the idea again. |
| Homepage benefits, first experiment | Nonwin | Both variations underperformed; the control was retained. |
| Homepage member testimonials | Winning decision | Completed applications +13.97%. Context: overall application resumes +4.86%; starts -2.94%; new-visitor resumes declined. Featured above. |
| Menu navigation | Winning decision | Completed applications +4.42%, with an uncertain estimate. Permanent implementation was not confirmed. |
| Homepage-benefits followup | Winning decision | Completed applications +6.52%, with an uncertain estimate. Context: application resumes -21.63%, also uncertain. Featured above. |
| Font-size followup | Nonwin | Flat-to-negative result; the test was stopped and the control restored. |
The program recorded which variations were selected as winners, which were revisited and which were stopped. It did not establish a combined revenue result, a lift in funded accounts, or permanent adoption of every winning variation.
Measurement appendix
Rates divide recorded events by the users exposed to each version. “Completed applications” is the measured finished-application event. It does not mean approved, funded or activated accounts. Relative lifts use the underlying counts; displayed rates are rounded.
| Experiment | Control events / users | Variation events / users | Reported confidence | Reported conservative lift |
|---|---|---|---|---|
| Application expectations | 73 / 558 | 91 / 572 | 91.17% | 9.92% |
| Member testimonials | 209 / 22,627 | 235 / 22,323 | 91.66% | 6.58% |
| Benefit tiles followup | 103 / 8,750 | 110 / 8,773 | 67.84% | 0.00% |
- Application saves: 10 / 558 versus 16 / 572; 87.08% reported confidence. The 26-event result needs caution.
- Returning-visitor resumes: 18 / 8,057 versus 33 / 7,822; 98.61% unadjusted confidence. This subgroup was selected after inspection, without adjustment for selection.
- Benefit-tiles followup resumes: 42 / 8,750 versus 33 / 8,773. The source's one-tailed confidence that the variation was better was 14.62%; that is not a separate test proving harm.
- Social-proof widget: starts had 87.89% reported confidence; completed applications had 45.26% confidence that the variation was better.
- Product benefit tiles: starts had 79.39% reported confidence; completed applications had 48.91% confidence that the variation was better.
- Menu navigation: 59.00% reported confidence and 0.00% conservative completion lift.
The three featured examples are selected from the complete program; they do not establish an independent statistical success rate.
Frequently asked questions
What did this credit-union testing program include?
It included 11 A/B experiments across eight groups, from application-opening instructions to homepage messaging, benefit tiles, testimonials, font size and menu navigation. Testing ran from January 28 through May 20 within the January-May 2026 program.
Did all six winning decisions increase completed applications?
No. Four decisions used completed applications; two used application starts. In the two start-focused wins, completed-application estimates were slightly negative and uncertain. The full results retain that distinction.
What changed in the application-expectations experiment?
The variation led with a five-minute expectation and a visible requirements checklist. Learn More remained available. The experiment measured application events, not whether people finished within five minutes.
Are the two individual credit-union studies additional client programs?
No. The application-expectations and homepage member-stories studies describe individual experiments from this same program.
Does this study show revenue or funded-account growth?
No. Its results concern recorded application events and program decisions. A completed application is not an approved or funded account, and this study does not report a combined revenue estimate.
How certain were the featured results?
The results had different levels of uncertainty. The benefit-tiles followup had an observed positive completion estimate and a zero conservative lift. The appendix retains the original confidence figures, counts and the limitations of the selected secondary results.
Review your application flow
See how we approach financial-services conversion rate optimization, or compare the purchase-flow work in our gift-card marketplace testing program.
View CRO program pricing and discuss the application step your team wants to improve.