
A/B Test Win Rate: What the Data Actually Says
Last updated: June 16, 2026 | Published: June 8, 2026
Last Updated: June 16, 2026 | Reviewed by Devon Cox, President, ConversionTeam
 A/B test win rates at a glance - see the full infographic
ConversionTeam audited its recent client testing history - 2,288 A/B tests that ran to a clear win-or-lose result across 71 client engagements - and published the win rate under every definition the industry uses. The short version:
Ask ten CRO vendors what their win rate is and you will get ten different numbers, none of them with a definition attached. The figures that circulate publicly are a mix of survey self-reports with no stated sample, platform averages quoted out of context, and marketing claims that quietly drop the losing tests. The result is that one of the most common questions in conversion optimization - what percentage of A/B tests actually win - has never had a well-sourced public answer.
This page is ConversionTeam's answer. We reviewed every A/B test in our recent client history and scored each one against its recorded results, applying a fixed definition of winning and losing. Rather than picking the most flattering number, we publish the full ladder: the rate under four different definitions of a win, from strictest to broadest, computed per test and per test group, then sliced by test element, industry, and business model. The definitions and the limitations are documented in the methodology section.
Whether you run an in-house program or are evaluating an agency, you can use this data to benchmark your own results, sanity-check a vendor's claim, or settle on which definition of winning your team should report.
 Field Notes
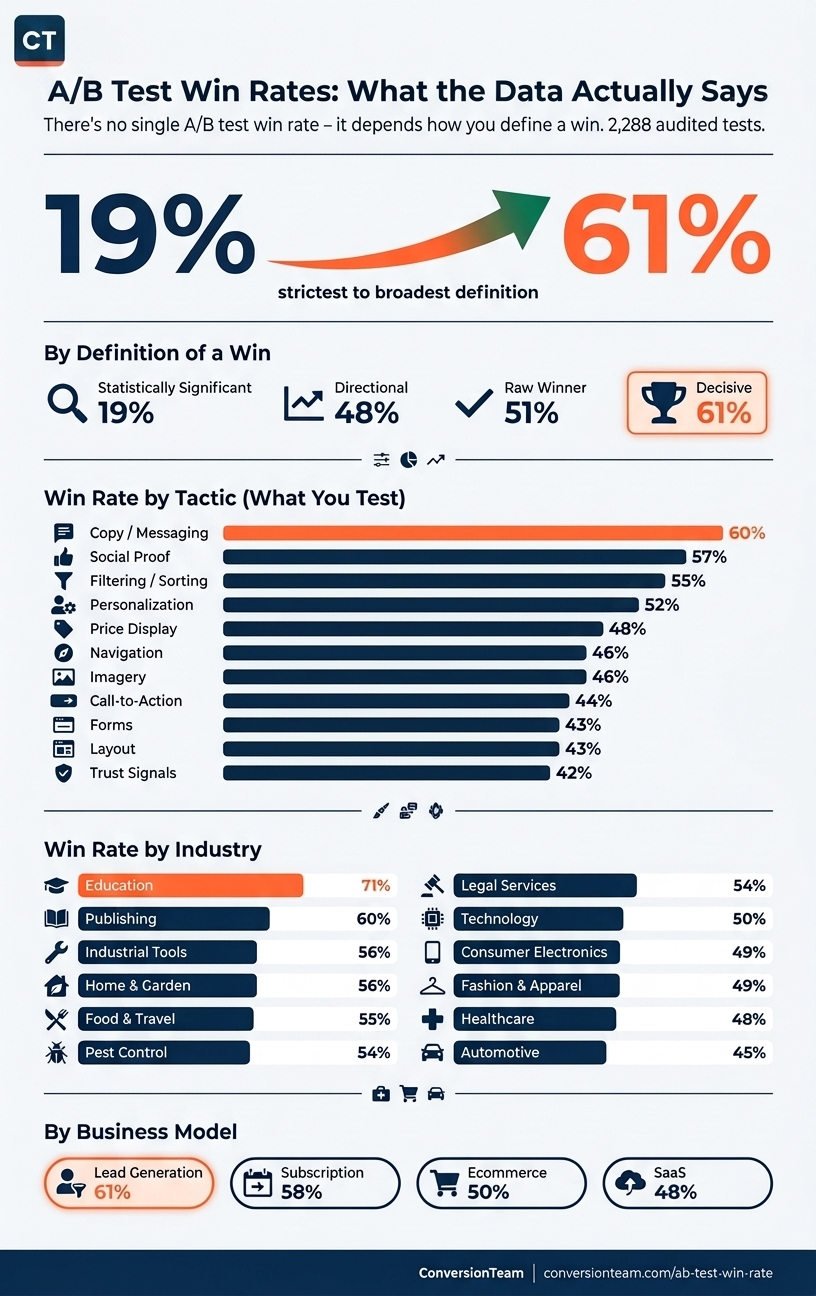
"There's no single A/B test win rate - it depends entirely on how you define a win. About 1 in 5 of our tests reach statistical significance. Right around half win outright. And our program-level rate, which groups each test with its follow-up iterations, is about 61%. Same tests, three numbers, all true."
The rate moves substantially with two choices: which definition of "win" you apply, and whether you score every test on its own (per test) or group each test with its follow-up iterations and score the test group. The table below shows the same 2,288 tests under all four definitions - the ladder, from strictest to broadest - computed both ways.
| Definition of "win" | Per-test rate | Test-group rate | What it means |
|---|---|---|---|
| Raw winner | 50.5% | 59.9% | The variation was shipped, or it was clearly ahead on the primary metric |
| Statistically significant | 19.1% | 25.4% | The win cleared a significance threshold - the strict definition |
| Directional | 48.2% | 57.5% | The variation beat control on the primary metric (significant or not) |
| Implementation-inclusive ("decisive") | 51.7% | 61.1% | A win counts if the test was acted on, or won outright |
Denominator = 2,288 A/B tests that ran to a determinate win-or-lose result. The test-group column groups the 2,288 tests into 1,659 groups (464 multi-test iteration chains). Sampling margins for these rates are in the methodology.
The two rates worth memorizing sit at opposite corners of the table. The first is 19.1%: roughly one test in five produces a statistically proven winner. That is consistent with what the large testing platforms report across hundreds of thousands of experiments, and it holds at every company, on every platform. The second is 61.1%: the decisive rate at the test-group level. Both describe the same 2,288 tests. The distance between them is definitional, not spin, and it comes from two mechanisms: directional wins that never cleared significance, covered next, and scoring by test group, covered in the methodology.
Of the 1,156 winning tests, 438 cleared a statistical-significance threshold. The other 718 won without clearing it: most finished ahead on the primary metric (directional wins), and a smaller share were implemented on the strength of the read even though the metric never certified them. Those 718 are the bulk of the gap between the 19.1% significance rate and the broader per-test rates on the ladder.
The evidence that those wins are real and not wishful thinking: 331 of them (14.5% of all 2,288 tests) were implemented anyway - rolled out, set to 100%, or shipped to production. Teams do this when the variation is ahead, the direction is consistent, the downside is negligible, or traffic ran out before the math resolved but the read was clear enough to act on. Whether you count directional winners is the single biggest definitional choice in any published win rate, which is why we report every rung separately instead of blending them.
Field Notes
"Statistical significance is a guideline. When I start a new testing program with a client, I always tell them testing is both an art and a science. You can run a program that rules by statistical significance and only promotes the tests that clear it, but none of my clients, past or present, actually do that. The testing we do is about proving a variation beats the control - and sometimes it isn't statistically better, but we've run it in the wild for three weeks, it looks better, and it lines up with the long-term business objectives. At that point we promote it as a directional win, because that's how you keep momentum going in an A/B testing program. Holding that test another two weeks is a huge opportunity cost - you could be trying something new in that slot. So in the real world, statistical significance is a guideline, and the best testing programs treat it as one."
A good win rate depends on which definition you are using and how mature the program is. The working bands, from our data and the published industry figures:
The most useful frame is the ladder itself. A real testing program produces a small share of statistically bulletproof wins, a larger share of directional or shipped wins, and a meaningful share of clear losses that pay for themselves in what they rule out. A program reporting a win rate north of about 70% on any definition should make you suspicious rather than impressed; why a very high win rate can mislead covers the reasons.
Most win-rate comparisons fail because they line up numbers that measure different things. A platform's "12%" and an agency's "62%" are not in conflict; they answer different questions. The tables below pin every published figure we could verify to the rung of the ladder it actually belongs to, with its primary source and sample size - and flag the figures whose calculations differ.
| Source | Figure | What it measures | Sample |
|---|---|---|---|
| ConversionTeam | 19.1% per test / 25.4% per test group | Statistically significant winner | 2,288 audited tests |
| Optimizely | 12% | Significant win on the primary metric | 127,000 experiments |
| Optimizely | 20% all / 10% revenue | Win rate across all / revenue-tied experiments | Optimizely client base |
| CXL / Convert | 20% | Reached 95% statistical significance | 28,304 experiments |
| Thomke & Ghosh | ~10% | Significant uplift on the primary metric | meta-analysis of 20,000 experiments |
| HBR (Kohavi & Thomke) | 10-20% | Experiments with positive results at big tech | Google, Bing, Microsoft |
| VWO | "~1 in 7" (~14%) | A "winning test" - definition not stated | not stated (in-app survey) |
| Speero | 20-30% | "Healthy" win-rate benchmark | benchmark, not a dataset |
| DRIP | 36.3% | Significant winner - inconclusive tests excluded from the denominator (not comparable to the rows above) | "thousands of tests" (self-reported), 91 ecom brands |
ConversionTeam's 19.1% per test sits above the large-platform averages (Optimizely 12%, VWO ~14%) and level with CXL/Convert's 20% - figures computed across hundreds of thousands of experiments. The outlier is DRIP's 36.3%, and it should be read with caution rather than envy: the sample is self-reported ("thousands of tests"), the hypotheses are pre-qualified, and inconclusive tests are excluded from the denominator. All three choices push the number up, and no other figure in this table is computed that way. Restated on DRIP's own denominator rule, ConversionTeam's significance rate is 20.2%.
| Source | Figure | What it measures | Sample |
|---|---|---|---|
| ConversionTeam | 48.2% per test / 57.5% per test group | Variation beats control (directional) | 2,288 audited tests |
| VWO (Industry Insights) | travel 40%, gaming/sports 60-70% | Variations that outperform control (directional) | "over 1 million tests" |
VWO's industry figures are frequently quoted as "win rates." They are directional - the share of variations that beat control, with no significance requirement - so they belong on this rung, where they bracket our numbers, not on the significance rung above.
The published "decisive" rates below are not all computed the same way, and the differences matter. DRIP excludes inconclusive tests from its denominator. ConversionTeam's internal reporting counts every inconclusive test as a loss, which is stricter. To make the row-to-row comparison fair, this table standardizes on one calculation - wins divided by wins plus losses, with inconclusive tests excluded - and shows our stricter internal figure alongside.
| Source | Decisive win rate (standardized) | Sample |
|---|---|---|
| ConversionTeam | 63.7% (61.1% counting inconclusive as losses) | 2,288 audited tests |
| DRIP | 62.1% | "thousands of tests" (self-reported), 91 ecom brands |
| GoodUI | 60% | 15 pattern-pre-selected tests |
| Blend | 58.86% (calculation not stated) | Shopify stores, Jan 2025 - Apr 2026 |
Standardized = test-group wins / (wins + losses) with inconclusive tests excluded from the denominator. ConversionTeam's 63.7% excludes the test groups that ran but produced no readable direction; the 61.1% figure counts those same tests as losses instead. Both are reported so neither framing hides the other.
On the same calculation, ConversionTeam's 63.7% leads the published figures. The cluster is tight - roughly 59-64% across every published first-party number - which is itself useful information: this is what real, mature testing produces at the test-group level, regardless of who runs it.
Read together, the rungs tell one consistent story: ConversionTeam's significance rate sits with the industry's strictest published numbers, and its decisive rate leads the published figures on the same calculation - with the full distribution in between documented rather than hidden.
Field Notes
"We talk with clients about low-hanging-fruit tests, and we run those at the start of every program. They're usually social proof and copy tests around the value proposition, because they're easy technically and they move the needle often. As you get deeper into a program and start testing structural items and UI elements, the win rate drops a little - unless you've identified real friction points through something like user testing or analytics. That's the difference: a program director changing something because the higher-ups decided they don't like it, versus testing something backed by evidence, qualitative or quantitative."
What you test predicts how often you win. This slice draws on the 1,272 tests (56% of the 2,288) with a classified element; the table shows the 11 elements that clear a minimum of 20 tests and 3 distinct clients.
| Test element | Tests | Raw winner | Statistically significant | Implementation-inclusive |
|---|---|---|---|---|
| Copy / messaging | 40 | 60.0% | 20.0% | 62.5% |
| Social proof | 215 | 56.7% | 18.6% | 56.7% |
| Filtering / sorting | 29 | 55.2% | 31.0% | 58.6% |
| Personalization | 169 | 52.1% | 18.9% | 56.2% |
| Price display | 50 | 48.0% | 16.0% | 50.0% |
| Navigation | 267 | 46.4% | 20.2% | 46.4% |
| Imagery | 81 | 45.7% | 14.8% | 46.9% |
| Call-to-action | 231 | 43.7% | 15.2% | 46.8% |
| Forms | 76 | 43.4% | 15.8% | 43.4% |
| Layout | 30 | 43.3% | 20.0% | 43.3% |
| Trust signals | 59 | 42.4% | 18.6% | 42.4% |
The spread runs nearly 18 points: copy and social proof tests win 57-60% of the time, while trust signals, layout, and form changes win 42-43%. The bottom of the table is not a list of things to stop testing - structural changes take more attempts to crack, and the wins there are often the larger ones. Note also that even the best-performing element reaches statistical significance about one time in five; the element shifts the raw odds, not the underlying math.
Win rate varies by industry, partly through buying behavior and partly through how much optimization headroom each site had at the start. Every row clears a 20-test minimum; results are aggregate and no client is named. Roughly 20% of tests are not yet classified by industry and appear only in the overall ladder.
| Industry | Tests | Raw winner | Statistically significant | Implementation-inclusive |
|---|---|---|---|---|
| Education | 21 | 71.4% | 23.8% | 71.4% |
| Publishing | 79 | 59.5% | 24.1% | 59.5% |
| Industrial tools | 126 | 55.6% | 17.5% | 57.9% |
| Home & garden | 128 | 55.5% | 15.6% | 57.0% |
| Food & travel | 152 | 54.6% | 18.4% | 55.9% |
| Pest control | 48 | 54.2% | 22.9% | 58.3% |
| Legal services | 69 | 53.6% | 20.3% | 53.6% |
| Technology | 216 | 50.0% | 21.8% | 50.5% |
| Consumer electronics | 191 | 49.2% | 18.3% | 49.7% |
| Fashion & apparel | 295 | 48.8% | 18.3% | 50.5% |
| Healthcare | 370 | 48.1% | 15.4% | 49.7% |
| Automotive | 69 | 44.9% | 14.5% | 44.9% |
The smallest cells (education at 21 tests, pest control at 48) should be read as directional. The largest cells - healthcare, fashion & apparel, technology, consumer electronics, food & travel - are the most statistically reliable.
Across very different industries, most raw win rates cluster between 45% and 60%, and significance rates between 15% and 24%. Industry shifts the odds at the margins; it does not rewrite the ladder.
Field Notes
"Losers are inevitable, and they're a valuable part of the program. Half of our tests don't win, and that's normal. What you do with those tests is what separates a good program from an average one. At ConversionTeam we almost always iterate a losing test into a winner, because during the test we collect the data we need to build the winning version."
The ladder holds across business models; what moves is how much easy headroom each funnel still has.
| Business model | Tests | Raw winner | Statistically significant | Implementation-inclusive |
|---|---|---|---|---|
| Lead generation | 209 | 60.8% | 22.0% | 62.2% |
| Subscription | 169 | 58.0% | 23.7% | 58.6% |
| Ecommerce | 1,216 | 49.9% | 16.9% | 51.4% |
| SaaS | 202 | 48.0% | 20.3% | 48.0% |
Lead generation and subscription tests win more often (58-61% raw) than ecommerce and SaaS tests (48-50%). Lead-gen and subscription funnels usually carry more visible friction to remove, while mature ecommerce sites have already been optimized hard and offer less easy headroom. Ecommerce is also by far the largest sample here at 1,216 tests, which makes its ~50% the most statistically stable single number on this page.
Field Notes
"A high win rate should scare you. A 70%-plus win rate is a red flag, and it's almost always the product of bad test methodology."
Win rate is the most quoted and most gamed number in CRO. Three things keep any published rate - including ours - in context:
What we measured. ConversionTeam's A/B-test win rate: the share of experiments that beat their control. This is a different metric from site conversion rate, which is the share of visitors who convert.
The denominator. The rates on this page are computed over 2,288 A/B tests from ConversionTeam's recent client testing history that ran to a determinate win-or-lose result - 1,156 wins and 1,132 losses - across 71 client engagements. A further 153 tests ran but their results could not be read with confidence; they are excluded from the denominator, and counting every one of them as a loss would put the raw rate at about 47%, which is the conservative floor.
How each test was scored. Every test was individually reviewed against its recorded results and scored under one fixed definition. A test that ran counts as a winner if it was implemented, virtually implemented, set to 100%, or shipped to production, or if its final results showed the variation ahead on the primary metric. A loser ran and finished flat, negative, or inconclusive, or was halted without a winning result. The bulk of verdicts came from a calibrated, audited scoring pass; uncertain cases were re-read independently and the stricter verdict kept, which corrected the raw rate down by about 2.5 points rather than up.
The ladder definitions. Over the same denominator: raw winner = any winner; statistically significant = a winner that cleared a significance threshold; directional = a winner with the variation ahead on the primary metric; implementation-inclusive = a winner, or any test acted on even without reaching significance.
The statistics. Statistical significance is a property of each individual test: ConversionTeam evaluates tests with a one-tailed t-test on the primary metric, and a test counts on the significance rung when its own results cleared that bar. The aggregate rates on this page are proportions over the 2,288 tests; their sampling uncertainty was estimated by bootstrap resampling (10,000 resamples) and is within roughly plus or minus 2 percentage points for the per-test rates, and plus or minus 2.5 points at the test-group level. The two calculations are independent: the t-test decides whether one test won; the bootstrap describes how precise the aggregate percentages are.
Test-group rate. The test-group ("decisive") rate groups iteration chains - a test and its follow-ups - and scores the group rather than each attempt, under fixed rules: every winning test counts individually; a loss is absorbed when its group also produced a win; an all-loss chain counts as exactly one loss. Group rate = total wins / (total wins + total losses). Grouping the 2,288 tests into 1,659 test groups lifts each rung by roughly 6 to 9 points, by collapsing repeated attempts at one hypothesis into a single loss and de-duplicating tests recorded under different names.
The standardized decisive rate (63.7%). Competitors like DRIP exclude inconclusive tests from the denominator when they publish win rates. Our internal basis is stricter: any test that ran without winning counts as a loss, including those with no readable direction. The standardized figure excludes those inconclusive tests from the denominator to match that calculation; both numbers are reported wherever the comparison appears.
Limitations. Roughly 20% of tests are not yet classified by industry or business model and appear only in the overall ladder. The element slice covers the 56% of tests with a classified element. Page-type and time-windowed rates are not included in this version. All slices are aggregate, no client is named, and every published cell clears a 20-test minimum.
What percentage of A/B tests win?
In ConversionTeam's audited data, 50.5% of 2,288 A/B tests produced a winner of some kind, and 19.1% reached statistical significance. Scored by test group - each test grouped with its follow-up iterations - the decisive win rate is 61.1%, or 63.7% on the calculation that excludes inconclusive tests. The right number depends on which definition of "win" applies.
What is a good A/B test win rate?
For statistically significant winners, 10-25% is healthy; the major platforms report 12-20%. For the decisive win rate (wins versus wins plus losses), published first-party figures cluster around 58-64%. Above ~35% on the strict significance definition, or ~70% on the decisive definition, start asking how wins were counted.
What is the average A/B test win rate?
Published industry figures run 10-30% depending on the definition: the major platforms report 10-20% of tests reaching statistical significance (Optimizely 12% across 127,000 experiments, VWO roughly 1 in 7, CXL/Convert 20% of 28,304 experiments), and Speero's healthy-program benchmark is 20-30%. ConversionTeam's audited significance rate is 19.1% per test.
Why is the significance win rate so much lower than the raw win rate?
Because most winning tests do not win by a margin large enough, or with enough traffic, to clear a significance threshold. Of ConversionTeam's 1,156 winning tests, 438 cleared significance and 718 won without clearing it; 331 of those were implemented anyway on the strength of the read. The directional-winner question is the main reason two published win rates rarely match.
What is a "decisive win rate"?
Wins divided by wins plus losses - the share of decided tests that won. On the standard calculation, which excludes inconclusive tests, ConversionTeam's test-group rate is 63.7% (DRIP reports 62.1%, Blend 58.86%). On ConversionTeam's stricter internal basis, which counts inconclusive tests as losses, it is 61.1%.
Does a high A/B test win rate mean a testing program is good?
Not by itself. Effect size matters as much as frequency - many small wins can be worth less than a handful of large, compounding ones - and rates past ~70% usually mean the inconclusive tests went missing. Read any win rate with its definition, its sample size, and the size of the wins.
Which test elements win most often?
In ConversionTeam's data, copy and messaging tests (60.0% raw) and social proof tests (56.7%) win most often; trust signals, layout, and form changes win least often (42-43%). No element category clears significance on more than roughly one attempt in five.
What A/B test win rate should an ecommerce store expect?
Across 1,216 ecommerce tests, the raw win rate was 49.9% and the statistically significant rate 16.9%. Mature ecommerce sites win somewhat less often than lead-generation or subscription businesses because they have usually been optimized harder and carry less easy headroom.
How is A/B test win rate different from conversion rate?
Win rate is the share of experiments that beat their control. Conversion rate is the share of visitors who complete an action. A test can win while the page's overall conversion rate remains low. This page is about win rate.
Cite this data
ConversionTeam A/B-Test Win Rate Benchmark (2026): across 2,288 audited A/B tests, 19.1% reached statistical significance (25.4% by test group), 50.5% won outright, and the test-group decisive win rate was 61.1% - 63.7% on the calculation that excludes inconclusive tests. Source: ConversionTeam, https://www.conversionteam.com/ab-test-win-rate/
ConversionTeam runs the testing program these numbers come from. Some of the individual experiments behind them are written up in our CRO case study library, and the mechanics of designing and calling tests live in our complete guide to A/B testing. If you want a program that reports its win rate with the definitions attached, see how we work.