
Highlights
- The original homepage went straight from the account-opening section to site search.
- The variation added a blue carousel of member testimonials, with star ratings, between the two.
- Completed applications per homepage user rose from 0.92% to 1.05%, +13.97% relative.
- Among returning visitors, the application resume rate rose from 0.22% to 0.42%, +88.84% relative.
The Challenge
The credit union’s account-opening section was followed by site search. There was no testimonial carousel between them.
Our Solution
We placed a carousel of member testimonials directly below the account-opening section. Visitors scrolling past the Open an Account button would reach it before site search.
Technical Implementation
What visitors saw in each version, top to bottom:
Control:
- Account-opening section with the Open an Account button
- Site search
Variation:
- Account-opening section with the Open an Account button, unchanged
- New: a blue carousel labeled Member Story, showing one testimonial at a time with the member’s name and a star rating
- Site search, unchanged
Homepage order Diagram
Control: original homepage
- Account-opening section with the Open an Account button
- Site search section
Variation: testimonial carousel added
- Account-opening section with the Open an Account button (unchanged)
- New: blue carousel of member testimonials, one at a time, with name, star rating and arrows
- Site search section (unchanged)
Simplified page layout. The mobile captures show the new carousel between account opening and site search. Gray masks hide identifying text and photos; the captures have different heights.
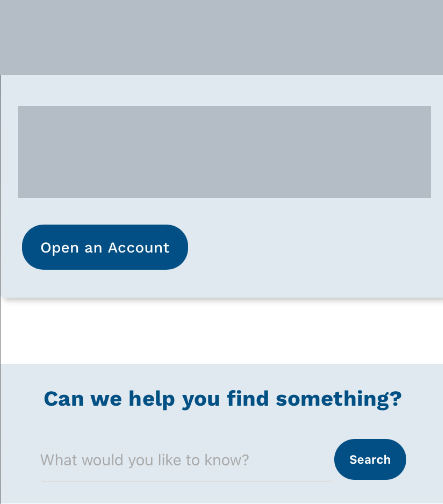
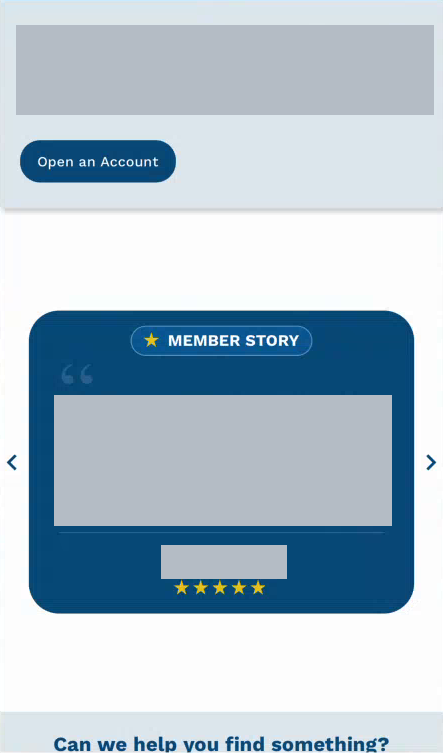
The carousel held three testimonials. Visitors could move between them with arrows, and it also advanced on its own, pausing while the cursor was over it. It ran on desktop and mobile. The application form wasn’t part of the test.
The Results
Completed applications per homepage user rose 13.97%. Among returning visitors, the application resume rate rose 88.84%. The returning-visitor group was already in the test dashboard, but this result was picked out after the data was reviewed.
Overall rates divide by everyone who saw that version of the homepage. The returning-visitor resume rate divides only by returning visitors in each version.
| Outcome | Original homepage | Homepage with testimonials | Relative change |
|---|---|---|---|
| Completed applications (primary) | 0.92% | 1.05% | +13.97% |
| Application resumes among returning visitors (secondary) | 0.22% | 0.42% | +88.84% |
| Application resumes, all homepage users | 0.26% | 0.27% | +4.86% |
| Application starts, all homepage users | 3.75% | 3.64% | -2.94% |
Across all homepage users, the application resume rate rose 4.86%, while the start rate fell 2.94%. New visitors had a lower resume rate in the variation. The returning-visitor lift doesn’t describe the full audience.
Resuming an application is an intermediate step. The event counts don’t show how many different people resumed or whether those applications were later completed or funded. The reported confidence for starts was low, so the observed decline doesn’t establish that the carousel discouraged applications. Statistical details are in the appendix.
Why It May Have Worked
Social proof may help when a visitor is weighing a decision. Here, members’ experiences appeared beside the invitation to join, which could offer reassurance before an application.
Trust wasn’t measured, and we don’t know why starts and completions moved in different directions. These results compare events per homepage user; they don’t track whether reading a testimonial helped an individual finish.
For social proof in a different setting, see our cruise itinerary review study.
Appendix
Test parameters
- Homepage users: 22,627 control, 22,323 variation.
- Completed applications: 209 control, 235 variation.
- Application resumes among returning visitors: 18 events among 8,057 control visitors, 33 among 7,822 variation visitors. The exact rates are 0.22341% and 0.42189%.
- Application resumes across all homepage users: 58 control, 60 variation.
- Application starts: 849 control, 813 variation.
- Overall rates divide event counts by all homepage users in each version; the returning-visitor resume rates use only that subgroup’s denominators. Displayed rates are rounded, and relative changes are calculated from the underlying counts.
- The source’s user-type groups do not sum to the overall totals. Each result retains its own source counts and denominator.
Statistical analysis
- Completed applications: 91.66% reported confidence, p = 0.083. The dashboard’s conservative lift estimate was 6.58%, a separate figure from the 13.97% observed lift.
- Application resumes among returning visitors (
resume_application): 98.61% reported confidence, p = 0.014. This is the dashboard’s unadjusted one-tailed comparison for that subgroup. - The returning-visitor result was selected after reviewing the existing secondary outcomes and audience groups. It was not established as a planned subgroup hypothesis, and the reported confidence does not account for that selection.
- Application resumes across all homepage users: 60.18% reported confidence.
- Application starts: 26.80% reported confidence.
- Confidence figures and the conservative estimate are reported as calculated in the test dashboard using CT’s one-tailed method.
- The available data doesn’t establish the traffic-allocation method or confirm event-tracking accuracy, and it doesn’t show which visitors interacted with the carousel.
FAQ
Where did the testimonials appear?
Between the homepage account-opening section and site search, on desktop and mobile.
What counted as a completed application?
An event recorded when someone finished the account application. The rate divides those completions by everyone who saw that version of the homepage.
Did the test change the application form?
No. The test added the homepage carousel. The form wasn’t part of it.
Did more people start applications?
The observed start rate was 3.64% for the variation versus 3.75% for control, a -2.94% relative change.
Did more completed applications mean more approved or funded accounts?
We don’t know. The report measures application events. It doesn’t establish how many applications led to approved, opened or funded accounts.
Related case studies
Our credit union application-preparation study tested a different change at the start of an application. The enterprise SaaS form-placement study looks at another step on the way to a lead, and there are more in the lead-generation case-study archive.
Related service: Conversion rate optimization.