Strategic brand storytelling boosted a luxury retailer's conversion rate by 18% and revenue by 12.7%. See how optimal content placement justifies premium pricing and transforms browsers into buyers through compelling narratives.
Highlights
We implemented and tested a “Brand Story” section with expandable content areas on product pages, placing it in two different locations to determine optimal positioning. Our solution delivered impressive performance gains that exceeded client expectations:
- 18% conversion rate increase (from 1.56% to 1.84%)
- 12.7% boost in revenue per visitor
- $273,662 in incremental revenue generated during the 14-day test period
The Challenge
The client’s product detail pages lacked content that effectively communicated their brand story and value proposition. Without this context, visitors couldn’t understand what made the products worth their premium price.
Competitors in the luxury space were effectively using brand storytelling to justify their premium pricing and build consumer trust.
Our Solution 💡
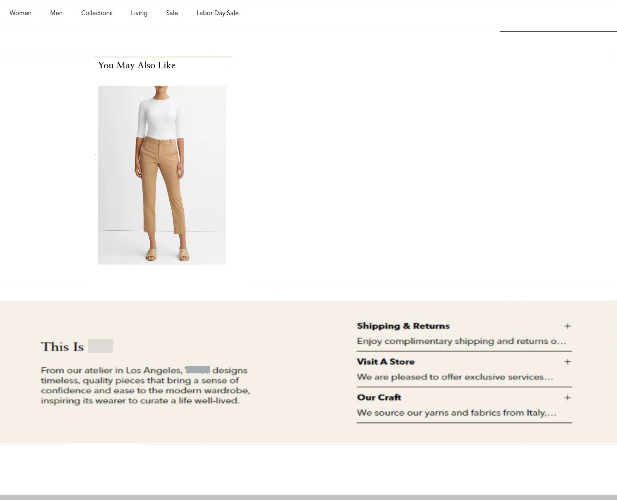
We developed a new “Brand Story” section with three expandable accordion elements containing brand information. The content highlighted the brand’s Los Angeles origins, design philosophy, and commitment to quality.
We tested two strategic placements:
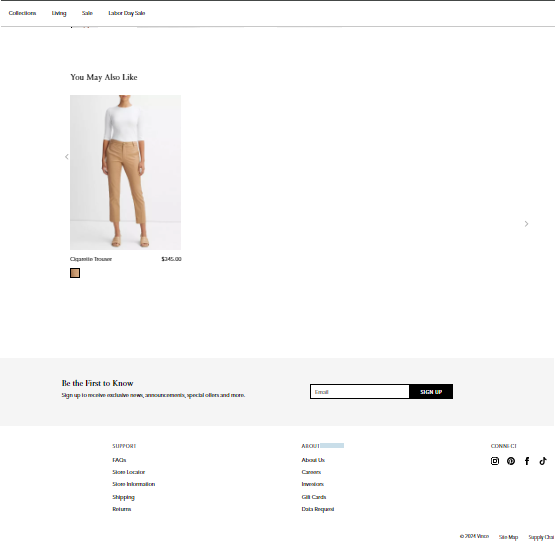
- Variation 1: Between the “Wear It With” and “You May Also Like” sections
- Variation 2: Below the “You May Also Like” sections
Each expandable section featured clickable headers that revealed additional content when opened. The copy emphasized the brand’s design approach, quality commitment, and lifestyle positioning.
Technical Implementation ⚡
The test targeted all visitors to product detail pages across:
- All devices (desktop, tablet, mobile)
- All browsers
- All user segments
- All product detail pages
We maintained the clean, minimalist aesthetic of the site while drawing attention to the new content. The accordion format allowed users to engage with content at their own pace without overwhelming the page layot. The accordion format allowed users to engage with content at their own pace without overwhelming the page layout.
The Results
| Metric | Control | Variation 1 | Variation 2 | Lift (V1) | Lift (V2) |
|---|---|---|---|---|---|
| Users | 151,768 | 152,482 | 27,265 | - | - |
| Transactions | 2,364 | 2,375 | 501 | - | - |
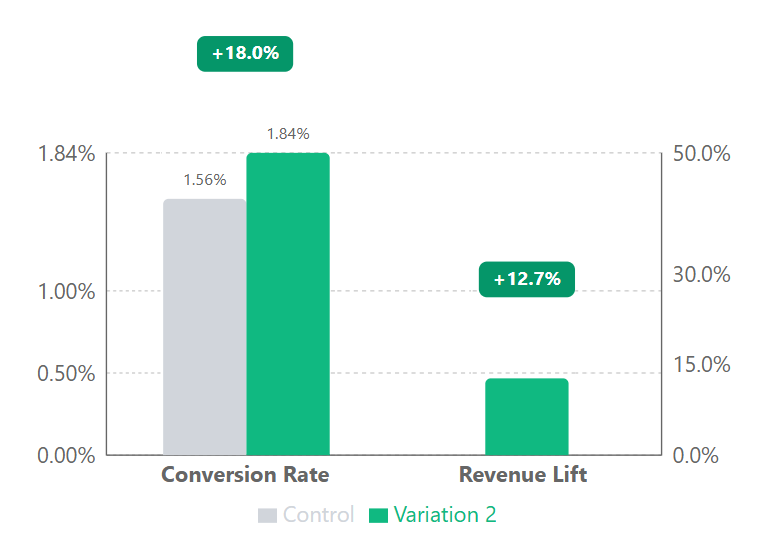
| Conversion Rate | 1.56% | 1.56% | 1.84% | 0% | 18.0% |
| Revenue Lift | - | 0.1% | 12.7% | - | - |
The data shows Variation 2 was the clear winner with 99% statistical confidence. The 18% conversion rate lift and 12.7% revenue lift significantly exceeded the client’s expectations of 5%.
Why It Worked 🎯
Our test proved that showing brand storytelling after product recommendations creates a natural purchase journey that boosts conversion by 18%. Users demonstrated clear preference for exploring products first, then diving into brand values – mimicking the in-store luxury experience where interest precedes education.
The expandable accordion design respected user control while maintaining visual hierarchy, allowing each visitor to engage at their preferred depth. This combination leverages three core conversion principles: cognitive sequencing (showing information in the optimal order), progressive disclosure (revealing details at the right moment), and choice architecture (giving users control without overwhelming them).
The whole test was about justifying a premium price, and price point is one of the biggest levers on conversion rate - our conversion rate by order value breakdown shows how much the normal rate drops as the average order climbs into luxury territory.
Let’s Talk 💬
Want to see how our precision-tested CRO approach can boost your luxury e-commerce performance? Get in touch for a strategy call where we’ll break down exactly how we can apply these insights to your product pages.
Appendix: Detailed test parameters and statistical analysis
| Test Parameters | Details |
|---|---|
| Device targeting | All devices (desktop, tablet, mobile) |
| Browser targeting | All browsers |
| User segments | All visitors |
| Page scope | All product detail pages |
| Statistical Analysis | Value |
|---|---|
| Confidence level | 99% for Variation 2 |
| Z-score | 3.20 for Variation 2 |
| P-value | 0.0006753 for Variation 2 |
| Conservative lift estimate | 12.7% for revenue per user |
| Sample size | 27,265 users for Variation 2 |
| Test duration | 14 days |
| Participation rate | 100% for all variations |
A brand-story block on these fashion PDPs drove a 12.7% revenue lift - vertical fluency worth weighing when you compare CRO agencies.