
Highlights
- In the original form, 13.08% of visitors finished their application. With the revised opening, 15.91% finished.
- Starts were almost identical. About 92 out of every 100 visitors began the application in both versions.
- The revised opening told applicants to allow five minutes and listed what they needed to have ready.
The Challenge
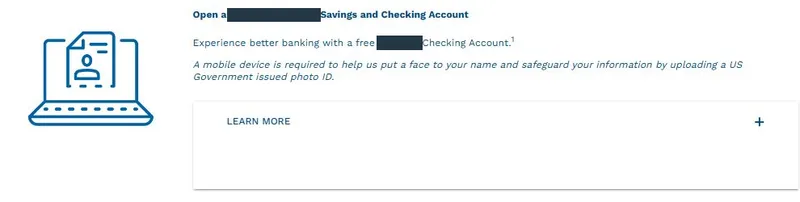
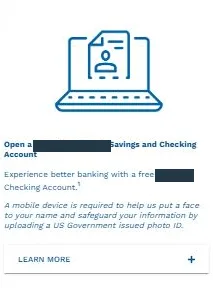
The credit union already told people they would need a mobile device to upload a government-issued photo ID. The opening screen left out other details they would need, including their Social Security number, current address and date of birth. The team wanted to know whether listing those requirements up front would help more people finish.
Our Solution
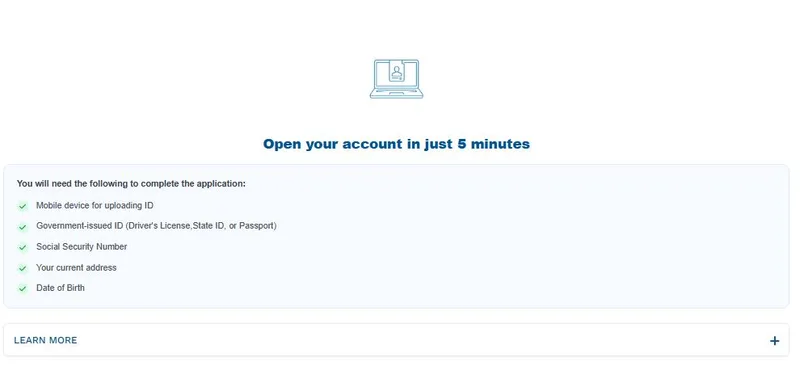
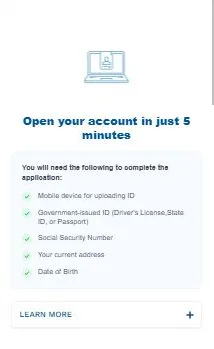
The variation opened with “Open your account in just 5 minutes.” Below it, a checklist listed the mobile device, photo ID and personal details an applicant would need. The team kept the Learn More option in both versions.
Technical Implementation
The team used Nantu to test two versions of the first application screen. The control kept the original introduction. Variation 1 moved a smaller illustration above the headline and grouped the requirements in a bordered panel with green checkmarks. Both versions kept the Learn More option. The team checked the layouts on desktop and mobile. After the winner decision, the team made Variation 1 the active version through Nantu on March 3.
Desktop comparison
Mobile comparison
The Results
Completed applications rose from 13.08% to 15.91% of visitors, a 21.61% relative lift. Starts were almost unchanged at about 92% in both groups.
| Application event | Original opening | New opening |
|---|---|---|
| Finished the application (primary outcome) | 13.08% | 15.91% |
| Started the application | 91.94% | 91.96% |
The 2.83 percentage-point difference in completions corresponds to the dashboard’s reported 21.61% relative lift. Completion tells us who submitted the application. Account approval and activation were outside the measurement.
Why It Worked
These are possible explanations. The team tested the whole opening together.
- The time estimate gave people a way to judge whether they could finish in one sitting.
- Listing the documents and personal details together gave people a chance to gather them before reaching those fields.
- Checkmarks made the requirements easier to pick out than the original paragraph.
- Moving the smaller illustration above the heading gave the instructions more room on both screen sizes.
Appendix
Test parameters
The progress report records a February 10 through February 24, 2026 run. The control had 558 visitors, 513 starts and 73 completions. The variation had 572 visitors, 526 starts and 91 completions. Both rates use all visitors assigned to the respective version. The screenshots cover desktop and mobile. The results here combine devices.
Statistical analysis
The primary dashboard event was finished_application. The test dashboard reports 91.17% confidence, p = 0.088, and a conservative relative lift estimate of 9.92%. The progress report marks the test a winner. The 21.61% figure is the dashboard result recorded for the February 24 decision. Later monitoring showed that the estimate continued to move.
The secondary event was start_application. Starts were nearly unchanged. The experiment did not isolate individual design elements or measure elapsed completion time.
Related reading:
- Lead generation case studies
- Form placement for a SaaS application
- Form testing for patient signups
- Trust signals in an A/B test
- Conversion rate optimization services
- A/B test win rate research
FAQ
What was new if the credit union already mentioned photo ID?
The variation kept the credit union’s ID requirement, added a time estimate and grouped all preparation requirements before the form. Completed applications rose from 13.08% to 15.91%, a 21.61% relative lift.
Did applicants actually finish in five minutes?
Five minutes was the promise in the credit union’s headline. The experiment measured a 21.61% relative lift in completed applications, from 13.08% to 15.91%. It did not measure elapsed completion time.
Does a 21.61% lift mean 21.61 more people finished out of every 100?
No. Roughly 13 out of 100 visitors finished with the original and 16 out of 100 with the variation. The difference is 2.83 percentage points. The 21.61% figure expresses that change relative to the original rate.
Which part of the new opening helped?
The new headline, checklist and illustration changed together. The combined opening produced a reported 21.61% relative completion lift, from 13.08% to 15.91%. This experiment cannot tell us how much any one element contributed.
Did the increase mean more approved credit union accounts?
The reported 21.61% relative lift, from 13.08% to 15.91%, measured submitted applications. Account approval and activation were outside the measurement, so this result does not establish an increase in approved or active accounts.