A leading cruise tour aggregator with strong reviews wasn't converting their excellent reputation into sales. By adding TrustPilot reviews to their booking pages, they saw conversion rates jump 35.4% and revenue increase 41.2% during the test period. This case study explores how social proof at key decision points can dramatically improve booking performance.
Highlights
Our clients reputation wasn’t translating into bookings. By strategically A/B testing trust widgets on their booking pages, we created a seamless integration that enhanced rather than interrupted the booking flow.
Social-proof widget testing on booking pages delivers outsized lifts when traffic is qualified but conversion lags - 41% revenue lift on a cruise aggregator here. High-consideration purchases reward patient, qualified-traffic testing, and that is fair to probe when you compare the best ecommerce CRO agencies.
Key achievements:
- Transactions increased by 31.2% (from 203 to 266 bookings)
- Conversion rate improved from 0.82% to 1.11% (35.4% increase)
- Revenue grew by 41.2%
💡 The Challenge
A CRO audit of the cruise itinerary pages revealed a clear missed opportunity - while the company had excellent TrustPilot ratings, these weren’t visible to customers during the booking process. For travel purchases where customers are spending thousands on vacation packages, seeing positive reviews from other travelers can be a crucial factor in their decision-making.
⚡ Our Solution
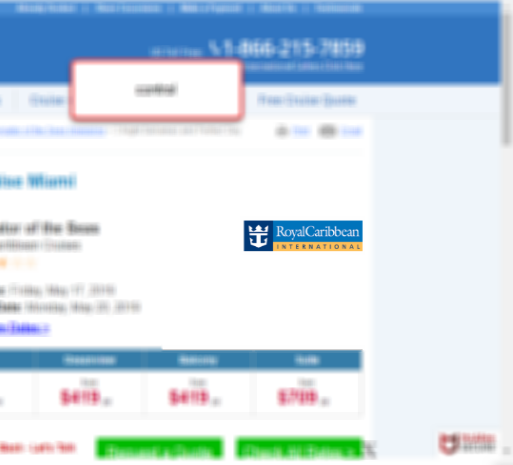
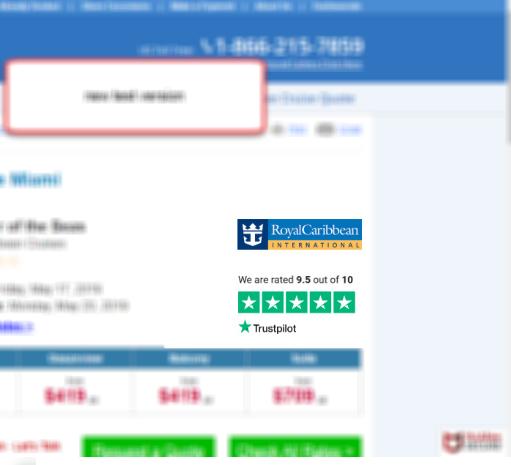
We kept it simple: Strategic placement of a TrustPilot widget on cruise itinerary pages. Here’s exactly what we implemented:
- Prominent TrustPilot badge showing real-time company ratings
- Responsive design for both desktop and mobile
- Careful placement to maintain existing user flow
- Click tracking to measure engagement
🎯 The Results
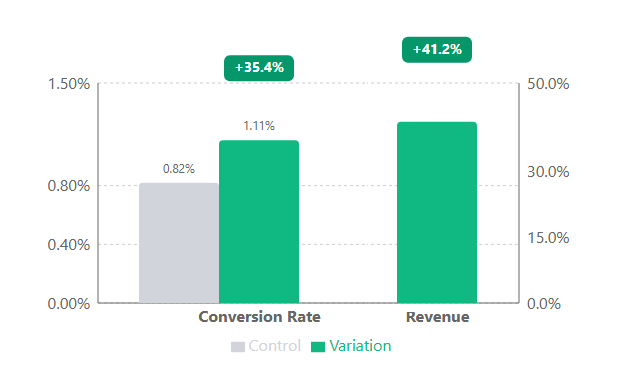
The impact of adding TrustPilot reviews to the booking pages was immediate and significant. The test drove a 35.4% increase in conversion rate (from 0.82% to 1.11%) and a 41.2% lift in revenue. Transaction volume grew by 31.2%, from 203 to 266 bookings. All metrics achieved statistical significance at 99% confidence.
| Metric | Control | Variation | Lift |
|---|---|---|---|
| Users | 24,756 | 23,964 | - |
| Transactions | 203 | 266 | 31.2% |
| Conversion Rate | 0.82% | 1.11% | 35.4% |
| Revenue Lift | - | - | 41.2% |
While these results appear unusually high - higher than we typically see from trust signal implementations - we know definitively that displaying trust signals improves booking performance. The dramatic improvements we saw during our 30-day test window will likely settle at more modest levels over a longer period. While we could run the test longer to get more realistic long-term estimates, that would mean delaying the rollout of a proven winner. In our experience, the opportunity cost of waiting usually outweighs the benefit of more precise numbers.
Why It Worked
Social proof is one of the most fundamental principles in conversion optimization. When customers are considering a significant purchase like a cruise vacation, they naturally look for evidence that they’re making the right decision. Our test showed that displaying TrustPilot reviews directly on booking pages bridges a critical trust gap - customers can see positive experiences from other travelers right at the moment they’re deciding whether to book.
- The TrustPilot widget provided immediate credibility since it shows verified customer ratings rather than curated testimonials
- Reviews had an even stronger impact on higher-value bookings, suggesting that social proof becomes more critical as the purchase price increases
That last point is worth benchmarking: the 0.82% base is low even for ecommerce, because a cruise is a multi-thousand-dollar, high-consideration buy - our conversion rate benchmarks for high-consideration purchases show how much a big-ticket decision depresses the rate, which is why social proof at the decision point pays off.
Let’s Talk 💬
Are you leaving money on the table by not properly showcasing your trust signals? Let’s analyze your conversion funnel and find out where strategic social proof could drive massive gains for your business.
Appendix: Detailed Test Parameters and Statistical Analysis
Test Parameters:
| Parameter | Details |
|---|---|
| Device targeting | All devices (desktop and mobile) |
| Browser targeting | All major browsers |
| User segments | All visitors to itinerary pages |
| Page scope | All cruise itinerary pages |
Statistical Analysis:
| Metric | Value |
|---|---|
| Confidence level | 99% |
| Statistical significance | Achieved |
| Sample size | 48,720 total users |
| Test duration | 30 days |
| Control/Variation split | Even split |