
Learn how we increased an e-commerce retailer's conversion rate by 6.6% with strategic cross-sells. Our vertical "offramp" solution generated an additional $5.4 million in annual revenue by solving decision paralysis and keeping customers in the purchase funnel. See the proven techniques that outperformed traditional carousel designs with 94% statistical confidence.
Highlights
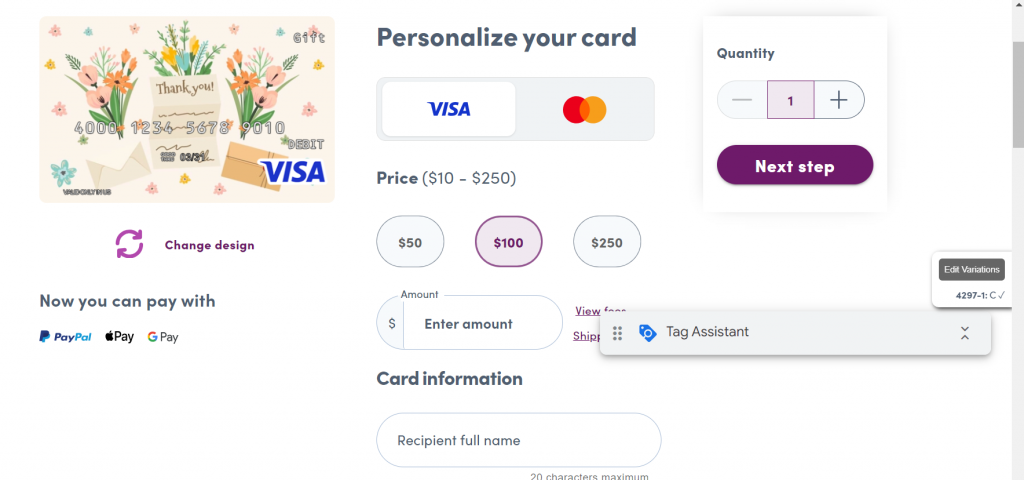
Users were abandoning product pages when specific cards didn’t meet their needs, without exploring alternatives. Our team implemented and tested vertical “offramp” navigation against horizontal carousels, providing relevant alternatives at decision points.
Cross-sell test design is one of the most underdeveloped AOV levers on production ecommerce sites - 6.6% revenue lift here from rethinking cross-sell logic. Few sites treat cross-sell as a measurable AOV lever, and the win rate on bets like this is the real test when you vet the top ecommerce CRO agencies.
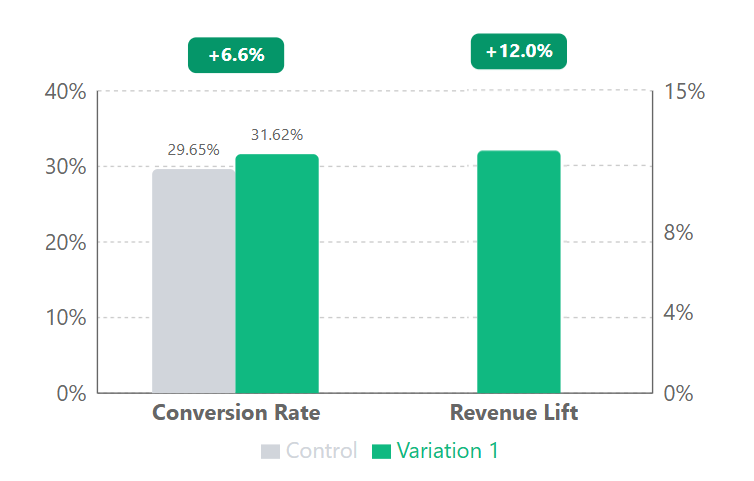
- The winning design delivered a 6.6% conversion lift (from 29.65% to 31.62%)
- Average transaction value increased by 10%
Our Solution 💡
We identified decision paralysis as the core issue. Our hypothesis was straightforward but powerful: adding clearly visible alternative card options as “offramps” on product detail pages would reduce abandonment and provide users with more relevant options.
Our team developed two distinct navigation approaches to test:
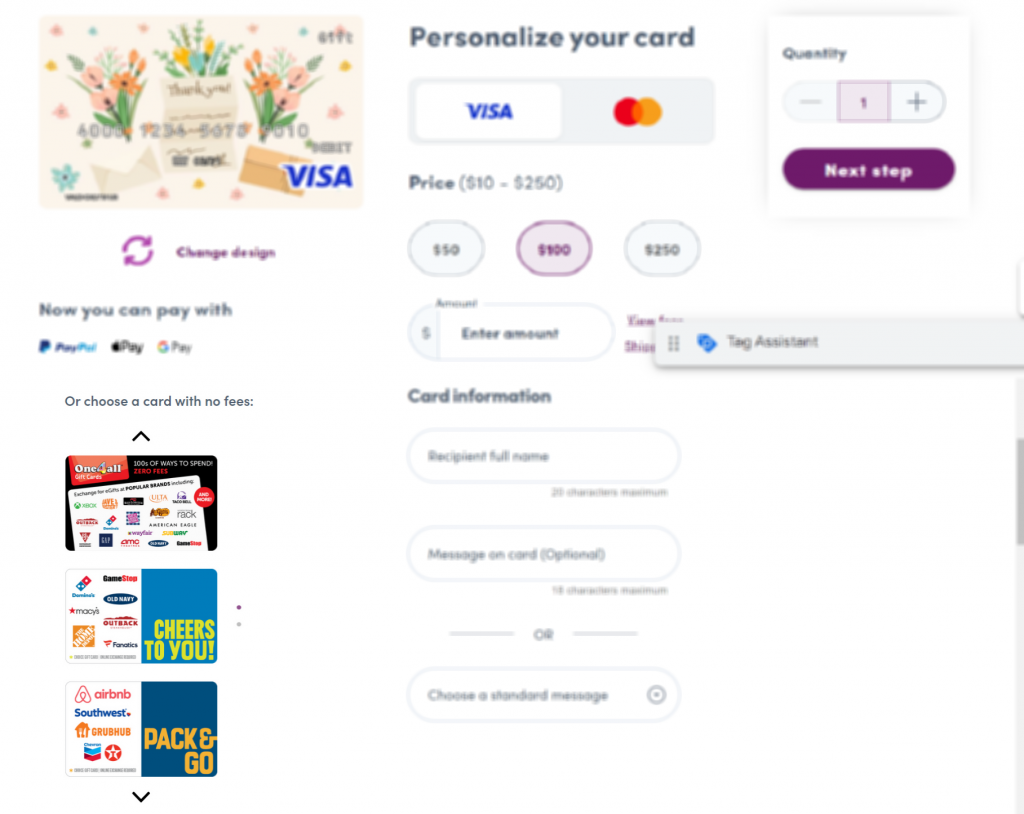
- Vertical offramp display - Alternative gift card options arranged in a clean, vertical layout below the main product
- Horizontal offramp carousel - Alternative options in a scrollable horizontal row
Both variations included intuitive navigation controls that matched the site’s existing design language, focusing on popular gift card categories.
Technical Implementation ⚡
Our experiment targeted all visitors viewing predesigned product pages and compared three variations: the control (standard product page with no offramp navigation), Variation 1 (vertical display of alternatives below the main product), and Variation 2 (horizontal carousel of alternatives). Variation 1, with its clean vertical layout of alternative products, emerged as the clear winner, delivering a 6.6% conversion lift over the control.
The Results
Let’s break down the results:
| Metric | Control | Variation 1 | Lift |
|---|---|---|---|
| Users | 2,772 | 2,821 | - |
| Transactions | 822 | 892 | - |
| Conversion Rate | 29.65% | 31.62% | 6.6% |
| Revenue Lift | - | - | 12.0% |
Why It Worked 🎯
The vertical layout’s success stems from two key conversion principles: reduced cognitive load and natural user scanning patterns. By presenting alternatives in a clean, vertically-aligned format, we made product comparison intuitive while keeping users within the purchase funnel.
Our data confirmed that simplicity drives results in navigation design. The 10% increase in revenue per user demonstrated that strategic alternative placement not only prevents abandonment but also guides users toward higher-value options. This matches established UX research showing that thoughtful choice architecture significantly impacts e-commerce performance. The base rate is the eye-catcher: 29.65% on these gift-card product pages, worlds above a typical store, because a gift card is a fast, low-friction buy - our stats show how much a normal conversion rate swings by product type, so a 6.6% relative lift on a base that high is a lot of revenue.
Let’s Talk 💬
Want to see how our approach to navigation design could boost your conversion rates? Let’s talk about your specific e-commerce challenges.
Appendix: Detailed Test Parameters and Statistical Analysis
Test Parameters
| Parameter | Details |
|---|---|
| Device Targeting | All devices (desktop, tablet, and mobile) with responsive designs for each variation |
| Browser Targeting | All major browsers were included in the test |
| User Segments | All user segments without specific targeting parameters |
| Page Scope | Limited to predesigned gift card product detail pages, not including personalized card creation pages or open-loop virtual cards |
| Test Duration | 30 days |
| Participation Rate | 80% |
| Sample Size | 5,593 users |
Statistical Analysis
| Metric | Value |
|---|---|
| Confidence Level | 94% |
| Z-score | -1.60 |
| P-value | 0.0553 |
| Conservative Lift Estimate | 3.7% |