
A North American cruise booking platform needed to improve their homepage performance. Through strategic A/B testing of value propositions, we discovered that expanding their messaging from "savings only" to "choice and savings" created remarkable results: 21% higher total revenue 34.1% improvement in conversion rate The winning value proposition "More Choices, More Discounts" outperformed both the control message "Pay Less For Discount Cruises Worldwide" and another variation with 95% confidence. Why did it work? Our data revealed that cruise shoppers respond better to a complete value proposition addressing multiple needs. Adding "choice" to the savings message created a more compelling story that resonated with customers.
Highlights
The travel industry often gravitates toward emotional messaging, but this case proves that addressing multiple core customer needs in a clear way can significantly outperform single-benefit value propositions. Here’s how we transformed a cruise booking site’s performance by expanding their value proposition from just “savings” to include both “choice and savings.”
Value-proposition testing for high-consideration purchases works in lead-gen verticals where the buyer needs a reason beyond price to commit - 21% revenue lift on a cruise booking platform here. Buyer-aware messaging test discipline at the level of a top CRO agency with lead-gen experience.
Through strategic A/B testing, we achieved:
- 21% higher total revenue
- 34.1% improvement in conversion rate
💡 The Challenge
Our client operates in the competitive online cruise booking space, targeting both budget and luxury travelers across North America. Despite having great pricing and excellent customer service, their homepage wasn’t effectively communicating these benefits to first-time visitors.
Previous optimization attempts focused on design tweaks rather than messaging. We knew there was a bigger opportunity: refining their core value proposition.
⚡ Our Solution
When data reveals a conversion problem, the key is developing a focused testing strategy that isolates the most impactful variable. In this case, we knew that value propositions directly influence how visitors perceive and engage with a brand, so we designed a test to identify which message would resonate most strongly with cruise shoppers.
We implemented a focused A/B test comparing three distinct value propositions:
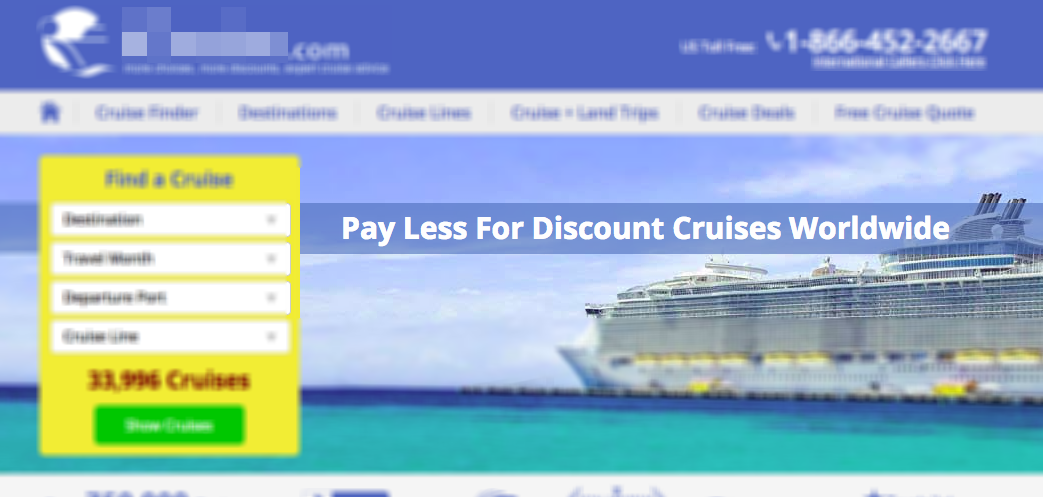
- Control: “Pay Less For Discount Cruises Worldwide”
- Variation 1: “Unbeatable Prices, Unforgettable Cruises”
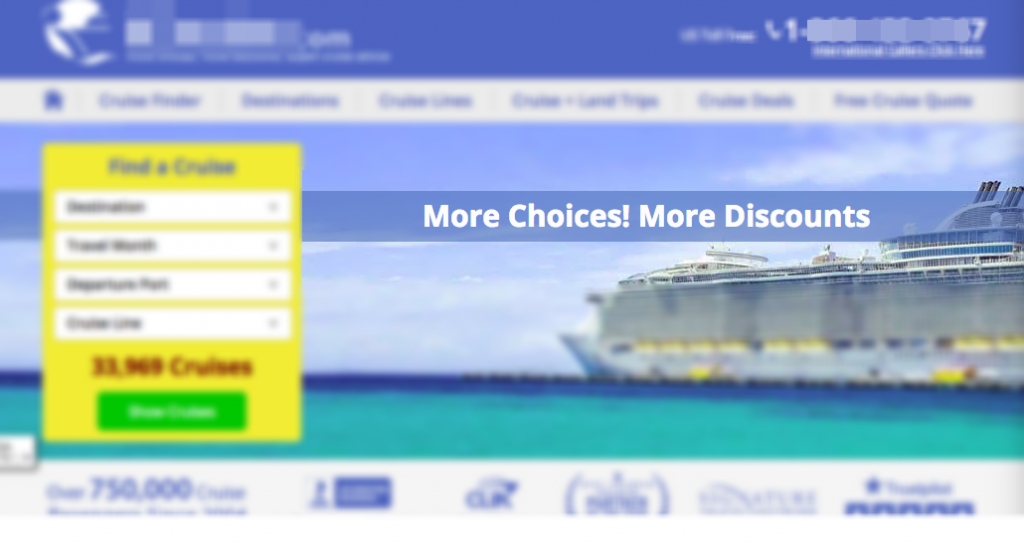
- Variation 2: “More Choices, More Discounts”
To ensure accurate tracking, we:
- Implemented unique phone numbers for each variation
- Used Nantu for precise data collection
- Targeted all devices and traffic types
- Monitored both conversion rates and revenue metrics
🎯 The Results
Results Table:
| Metric | Control | Variation 1 | Variation 2 |
|---|---|---|---|
| Users | 9,237 | 8,714 | 8,858 |
| Transactions | 42 | 27 | 54 |
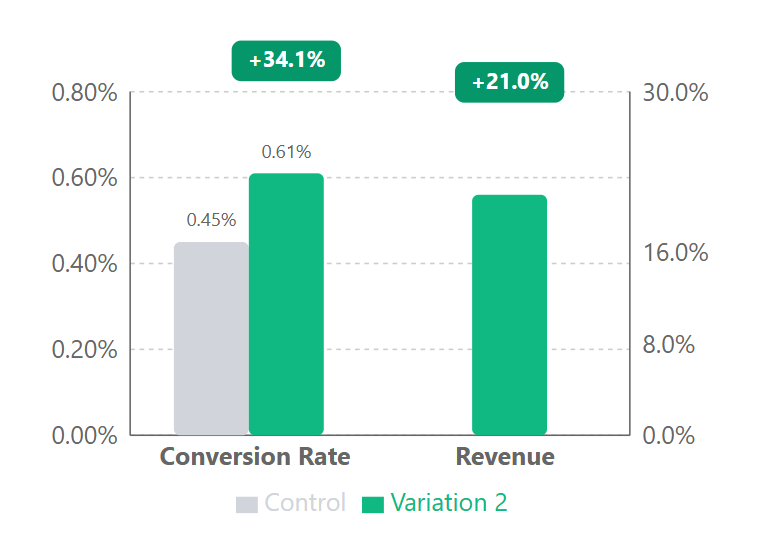
| Conversion Rate | 0.45% | 0.31% | 0.61% |
| Conversion Lift | — | -31.1% | +34.1% |
| Revenue Lift | — | +12.4% | +21.0% |
Variation 2 (“More Choices, More Discounts”) was the clear winner, outperforming both the control and Variation 1 with a confidence level of 95%. Not only did it produce the highest conversion rate, but it also delivered the strongest revenue results.
Reality Check
We made sure to advise the client that test results can sometimes show different outcomes in the long term due to sample variability and the shorter test period. What’s most important is that the test version performed statistically better than the control. If you wanted a more precise estimate of long-term revenue lift, you’d need to run the test longer—but this comes with trade-offs. Longer tests can delay rolling out the winning version, and for most tests, the opportunity cost of waiting isn’t worth it.
Why It Worked
Our data revealed two key insights about cruise shoppers:
✅ Adding choice to a savings message creates a more complete value proposition
✅ Both versions were clear and direct - but one told a fuller story
The control’s “Pay Less” message wasn’t wrong - it was clear and focused on a key benefit. But by simply adding “More Choices” to the savings message, we created a more complete picture of what matters to these customers. While both versions were straightforward, the winning variation succeeded by addressing two core customer needs instead of one. Think of it like the difference between “We have cheap shoes” versus “We have lots of shoes at great prices” - the second just feels more compelling because it addresses both selection and savings. Notice how low the raw numbers are: the winner still only converts at 0.61%, which is normal for high-consideration travel - our conversion rate statistics show how far below retail a booking funnel like this typically sits.
💬 Let’s Talk
Ready to discover what data-driven value proposition testing could do for your conversion rates? Let’s talk about finding your winning message.
Appendix: Detailed Test Parameters and Statistical Analysis
Test Configuration
| Parameter | Details |
|---|---|
| Device Targeting | All devices |
| Page Scope | Homepage only |
| User Segments | All traffic |
| Test Duration | Standard test period |
| Implementation | Nantu AB Test Tool |
| Traffic Distribution | Even split between variations |
Statistical Results
| Metric | Value |
|---|---|
| Total Sample Size | 26,809 users |
| Confidence Level | 94.25% |
| Conservative Lift Estimate | 34.1% |
| Statistical Significance | Achieved |