Facet & Filter Optimization Drives eCommerce Conversions
Leading eCommerce site for Medical Supplies & Equipment
Last Updated: May 11, 2026 | Reviewed by Devon Cox, President, ConversionTeam
The Client
The test ran in March of 2022.
Facet ordering tests on large-SKU catalogs are exactly the discoverability work CRO specialists should be running and reporting on across both D2C and B2B traffic. The kind of cross-funnel test methodology a conversion rate optimization agency brings to large-catalog ecommerce.
This eCommerce brand is a leader in the direct-to-consumer (D2C) and business-to-business (B2B) online sales of medical supplies and equipment. They hired ConversionTeam in 2019 to improve their conversion rate via the Iterate A/B testing program.
The Business Need
This online store has a tremendous number of stock-keeping units (SKUs). Therefore, its users need to be able to navigate, sort, and filter products fast and efficiently.
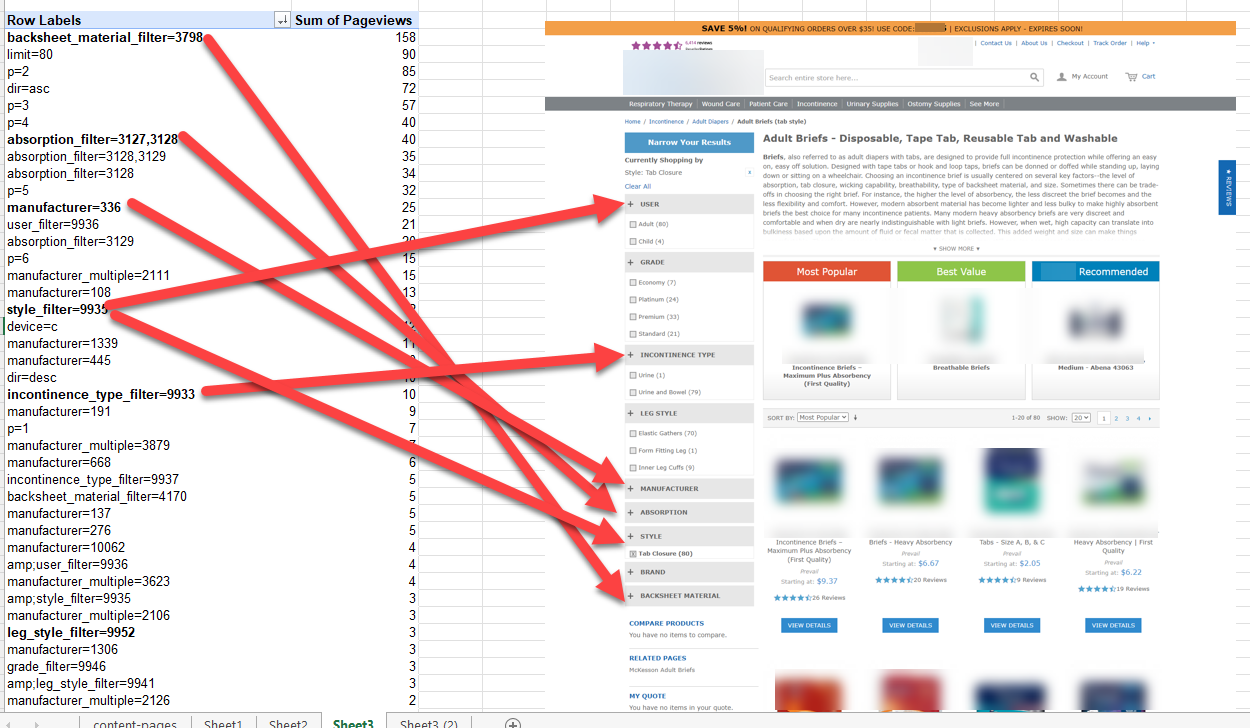
Based on heatmaps, it looked like users were taking more time than expected to filter products on the category pages. ConversionTeam analyzed their category facet usage and recommended a re-ordering of facet groups to move the most frequently used facets above the fold and default them to open.
Facet Usage
Solution
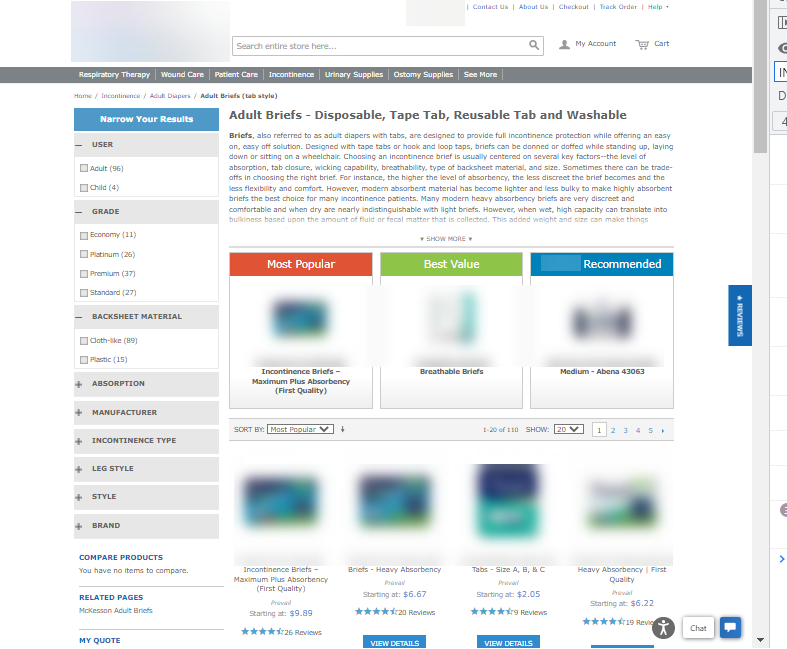
ConversionTeam created a test variation where the facets were organized according to how often they were used. The test was run on a small subset of categories due to the need to make the facet order specific by subcategory. This is a common way the ConversionTeam proves an enhancement on a subset of traffic before rolling it out to all traffic.
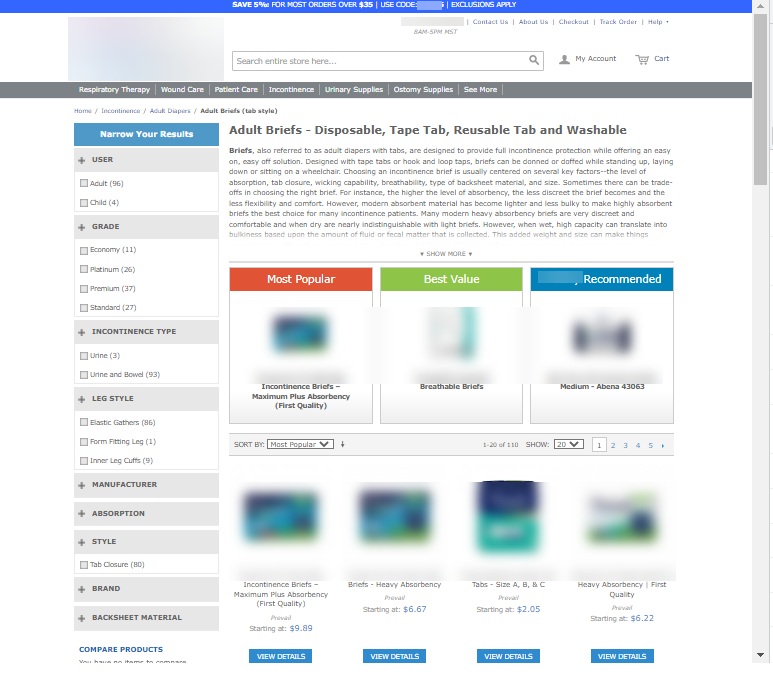
Control
Test Variation
Results
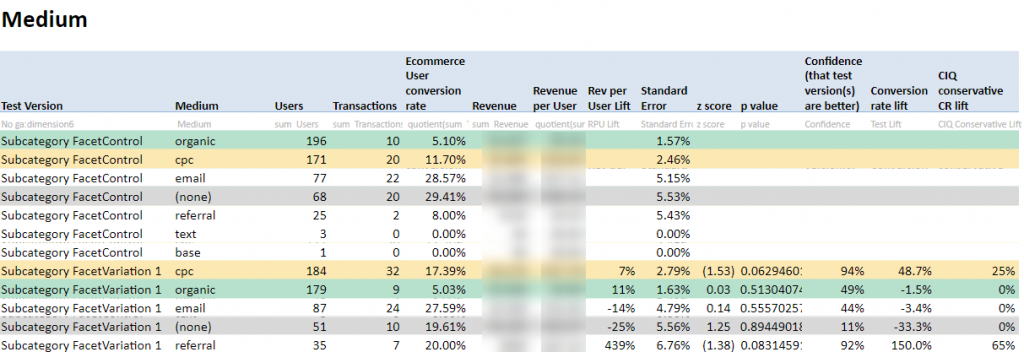
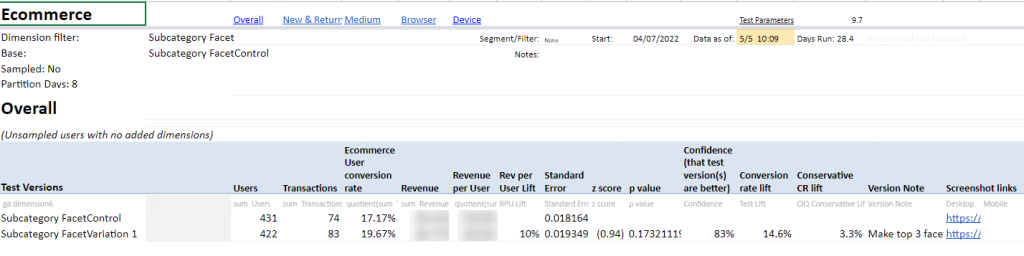
The test version did well, up 14.5% vs the control with a 10% revenue per user increase. While the confidence wasn’t at our target level (95%), we decided with the client to roll out the new version because:
- The new experience had better usability
- The results for paid traffic were very strong and very close to statistically significant
Overall data
Data by Medium