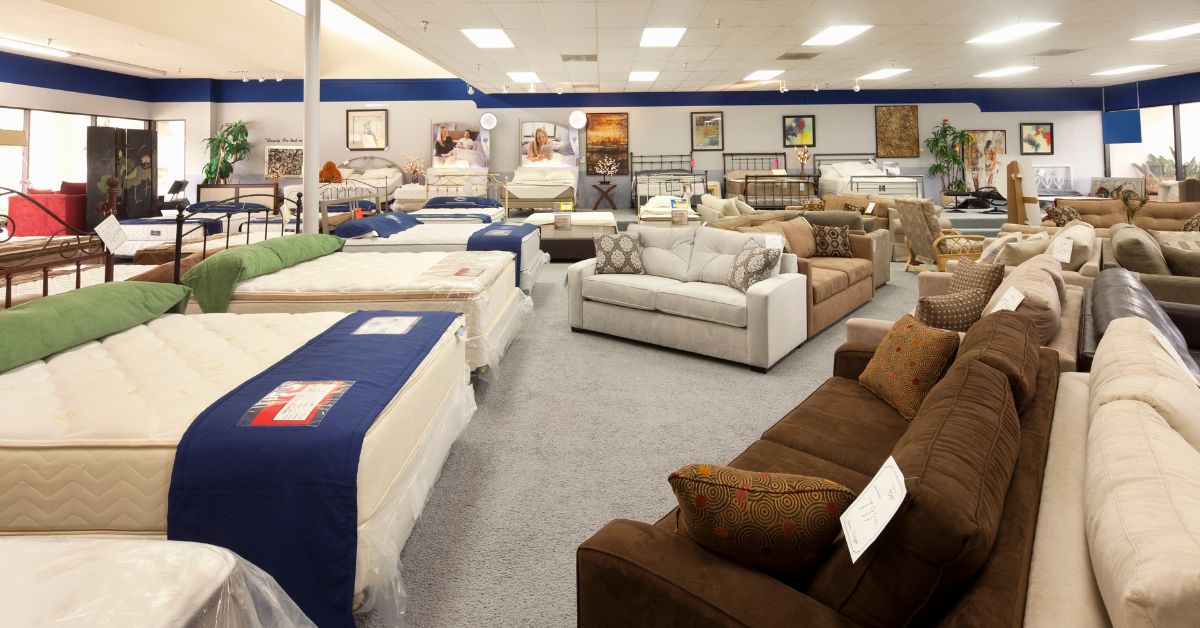
Discover how a simple PLP design change boosted conversions by 3.9% for a National Multi-Channel Furniture Retailer. By reducing products per row from 3 to 2, we created larger product images and clearer information displays—proving that for high-value purchases like furniture, visual clarity drives sales. This data-driven test ran across 339,858 users with 83% statistical confidence, delivering measurable revenue gains through smarter visual merchandising.Retry
Highlights
This furniture retailer partnered with our conversion rate optimization agency to tackle a critical user experience challenge by implementing a simplified 2-column layout across all product listing pages. The comprehensive test achieved significant results:
- 3.9% increase in conversion rate
- 2.0% lift in overall revenue
- Enhanced shopping experience with larger product images
The Challenge 💡
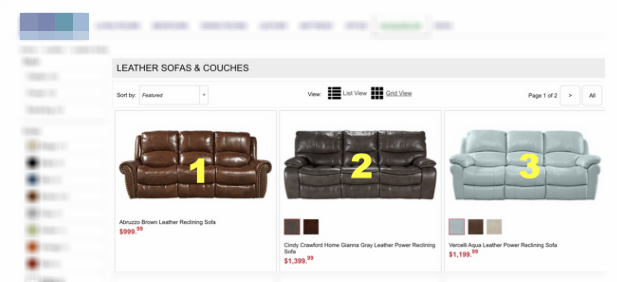
The retailer’s relatively cramped 3-column design created several barriers to purchase, particularly for high-value products like living room sets and outdoor furniture. The original design’s limited image sizes obscured important furniture details, while compressed product information made evaluating features difficult. This compact layout diminished the premium shopping experience expected by furniture buyers - a significant issue as these customers rely heavily on visual cues and detailed information for high-value purchase decisions.
Our Solution ⚡
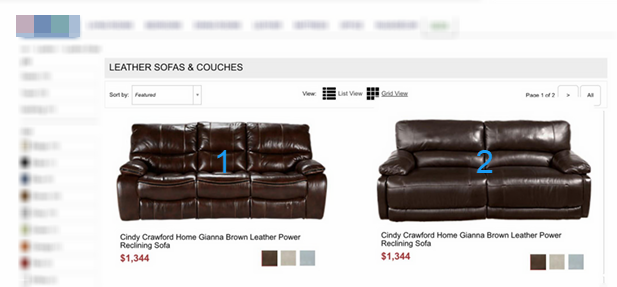
Through analysis of user behavior and industry best practices, we identified that improving conversion rates required enhanced product visibility and information clarity. Our solution was straightforward: reduce products per row from three to two. This allowed for larger product images, expanded information sections with clearer typography, optimized white space, and better mobile responsiveness across devices.
Technical Implementation
We implemented the new layout while ensuring no slowdown in page load times.
Key components included:
- Reconfigured grid system from 3 columns to 2 columns
- Enhanced image sizing for better product visibility
- Improved spacing between product cards
- Refined product information hierarchy
The Results 📈
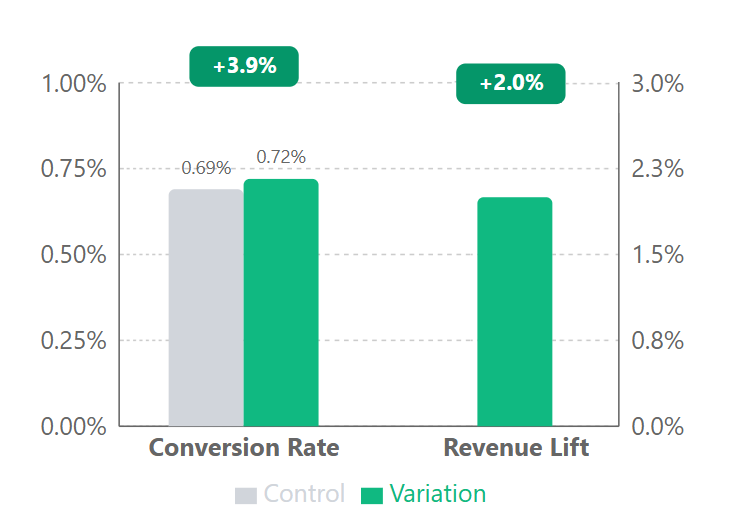
The test demonstrated significant improvements in user engagement and conversion metrics:
| Metric | Control | Variation | Lift |
|---|---|---|---|
| Users | 169,998 | 169,860 | - |
| Transactions | 1,177 | 1,222 | - |
| Conversion Rate | 0.69% | 0.72% | 3.9% |
| Revenue Lift | - | - | 2.0% |
Small Wins Add Up
While a 3.9% conversion improvement and 2% revenue lift might seem modest at first glance, these are exactly the kind of results that drive sustainable business growth. In e-commerce optimization, reliable small wins often outperform high-risk, dramatic changes. For a furniture retailer processing hundreds of thousands of monthly visitors, this “small” improvement translates to significant revenue gains. When you combine multiple optimizations like this across the customer journey, the compound effect can transform your business. This test exemplifies our approach: making data-driven, low-risk improvements that deliver consistent, measurable value. For context on that 0.69% starting point, our breakdown of baseline conversion rates by segment shows how far below the ecommerce average a high-consideration category like furniture usually sits.
Why It Worked 🎯
Furniture shoppers need to properly evaluate product details before purchasing, and the larger images with improved spacing directly addressed this need.
The layout change worked because it provided:
• Visual Confidence: Larger images and clearer information reduced purchase hesitation
• Simplified Evaluation: Better spacing improved product comparison capabilities
• Cross-Device Impact: The responsive design maintained experience quality on all screens
Let’s Talk 💬
Want to learn more about optimizing your product listing pages? Let’s discuss how these insights could apply to your ecommerce store.
Appendix: Detailed Test Parameters and Statistical Analysis
Test Parameters
| Parameter | Details |
|---|---|
| Device targeting | All devices |
| Browser targeting | All browsers |
| Page scope | All product listing pages |
| User segments | All users |
Statistical Analysis
| Metric | Value |
|---|---|
| Confidence level | 83% |
| Statistical significance | p-value of 0.173 |
| Sample size | 339,858 total users |
| Conservative lift estimate | 1% |
If you’re picking the best CRO agency for ecommerce, look at tests like this - a two-column PDP layout lifted this furniture retailer’s conversions 3.9%.