
A leading HR solutions provider struggled to showcase their comprehensive platform on their homepage. Our redesign better communicated their complete service offering through clear, structured content presentation. The result: an 18.5% lift in form submissions across more than 345,000 visitors, demonstrating that simplified presentation of complex B2B services drives better lead generation performance.
Highlights
A large B2B HR SaaS solutions provider came to us with a challenge: their homepage wasn’t converting visitors into leads effectively. Their premium HR outsourcing services needed a digital presence that matched their market-leading position.
Feature-completeness framing on B2B SaaS homepages converts decision-stage buyers evaluating against a feature matrix - 18.5% lead lift here. The kind of vertical-aware test design a top CRO agency brings to B2B SaaS engagements.
Here’s how we transformed their homepage into a lead-generation powerhouse, driving an 18.5% increase in form submissions with 96% statistical confidence.
The Challenge 💡
The data told a clear story: users weren’t engaging with critical service information below the fold. Despite offering comprehensive HR management solutions, the homepage failed to effectively communicate their value proposition.
Key challenges we identified:
- Limited engagement with service sections below the fold
- Unclear presentation of comprehensive HR solutions
- Poor content discovery on mobile devices
Our Solution ⚡
We implemented a data-driven redesign focused on clarity and user engagement. Our solution centered on streamlining the presentation of services with clear content blocks and benefit statements.
Key implementation elements:
- Redesigned content blocks with benefit-focused messaging
- Six icon-based benefit statements with supporting text
- Expandable content sections optimized for mobile users
- Enhanced “all-in-one” messaging to emphasize comprehensive services
Technical Implementation
Our approach targeted all modern browsers and devices with responsive design optimization. We maintained consistent navigation and header elements while enhancing the mobile responsiveness across all devices.
Test parameters:
- Duration: 49 days (Jan 14 - Mar 4, 2019)
- Total users: 345,684
- Device targeting: All devices
- Browser targeting: All modern browsers (IE 7-10 excluded)
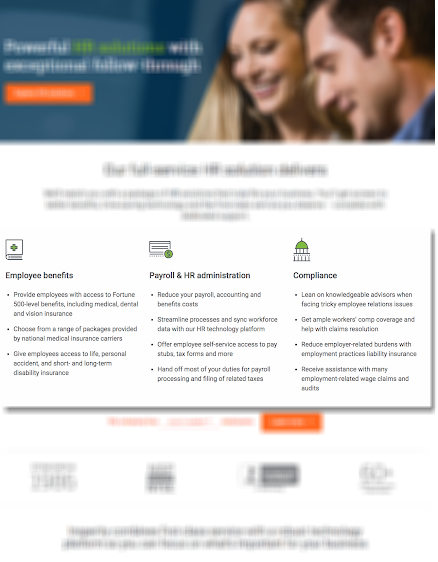
Original homepage layout featuring three service categories with bulleted lists of features. While informative, this layout limited visibility of the platform's full capabilities.
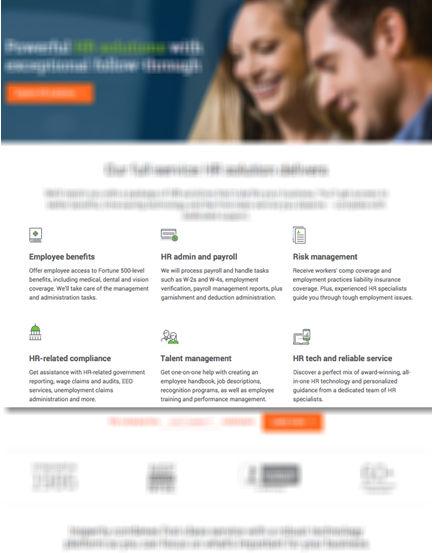
Expanded six-service grid that better showcases the complete HR platform. Added Talent Management, Risk Management, and dedicated HR Tech sections clearly communicate the comprehensive SaaS offering, leading to increased form submissions.
The Results 🎯
Quick highlights:
- Form submissions increased by 18.5%
- Conservative lift estimate: 11%
- Statistical confidence: 96%
- Test participation: 18.38% of traffic
Here’s the detailed data after 49 days:
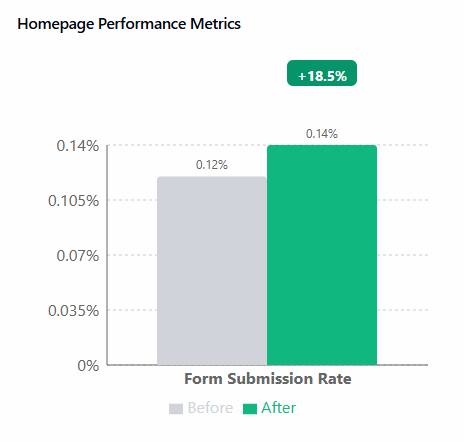
Results Table:
| Metric | Control | Variation | Lift |
|---|---|---|---|
| Users | 153,918 | 191,766 | - |
| Transactions | 179 | 264 | - |
| Conversion Rate | 0.12% | 0.14% | 18.5% |
Why It Worked
The success of this test reinforces several key principles in SaaS homepage design. Clear, benefit-focused messaging combined with strong visual hierarchy significantly impacted user engagement and conversion rates.
Key findings:
- Users responded strongly to the “all-in-one” messaging strategy
- Mobile-first approach maintained engagement while solving space constraints
- Improved visual hierarchy led to better content discovery
- Simplified presentation reduced cognitive load while maintaining detailed information
For Saas, particularly in complex industries like HR solutions, simplified presentation of comprehensive services helps potential clients better understand the value proposition. Our test results demonstrate that reducing cognitive load while maintaining detailed information availability creates an optimal environment for lead generation. Don’t let the 0.12% base rate throw you, since a homepage-wide form-submission rate for enterprise B2B runs exactly that low - our stats show why B2B lead-gen conversion rates look so different from the ecommerce figures most “average conversion rate” articles quote.
Let’s Talk 💬
Want to see similar conversion rate improvements for your B2B website? Let’s discuss how our data-driven approach can transform your digital presence.
Appendix: Detailed Test Parameters and Statistical Analysis
Test Configuration
| Parameter | Value |
|---|---|
| Test Duration | 49 days (Jan 14 - Mar 4, 2019) |
| Total Sample Size | 345,684 users |
| Participation Rate | 18.38% |
| Device Targeting | All devices |
| Browser Targeting | All modern browsers (IE 7-10 excluded) |
Statistical Analysis
| Metric | Value |
|---|---|
| Confidence Level | 96% |
| Z-score | -1.77 |
| P-value | 0.0381796 |
| Conservative Lift Estimate | 11% |