Discover how we boosted a luxury retailer's conversion rate by 7.1% with a strategic product collection section on their New Arrivals page. Our data-backed solution improved product discovery at critical decision points, resulting in significant revenue lift and enhanced customer experience. Learn the key conversion principles that made this implementation successful for high-end apparel shoppers.
Highlights
A premium luxury clothing retailer was struggling with limited product discovery and cross-category browsing on their New Arrivals page during the crucial holiday shopping season.
Smart-collection logic on luxury ecommerce turns New Arrivals pages from style showcases into revenue pages - 7.1% conversion lift from a single test. Vertical-aware UX work at the level of the leading ecommerce conversion rate optimization agencies with luxury track records.
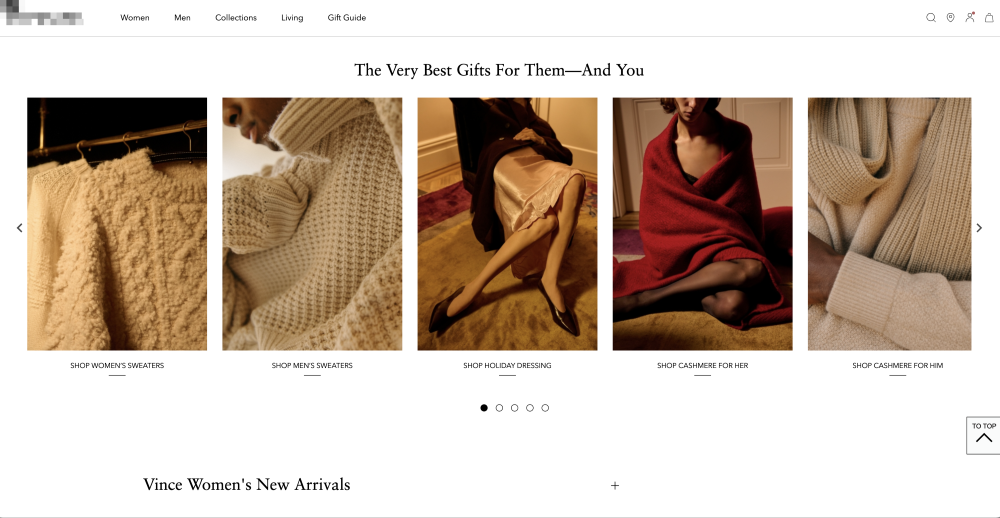
We implemented a “The Very Best Gifts” product collection section at the bottom of the page, featuring curated categories with lifestyle imagery and clear CTAs, optimized for both desktop and mobile experiences.
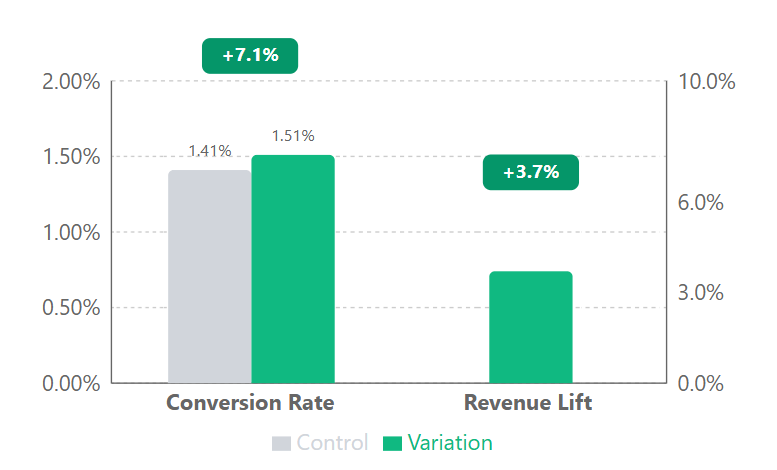
- 7.1% increase in conversion rate (from 1.41% to 1.51%)
- 3.7% revenue lift
The Challenge
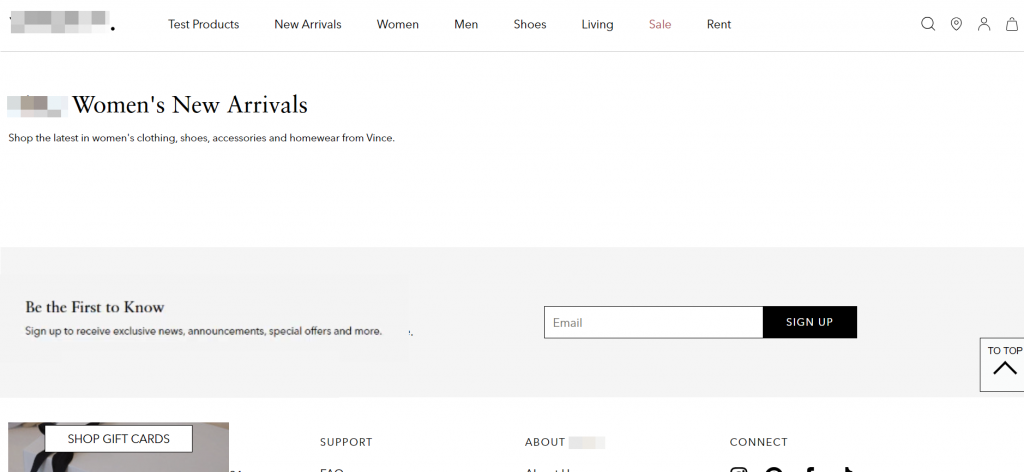
The client’s New Arrivals page was functioning as a standard product listing page but failed to effectively showcase their seasonal collections or encourage cross-category browsing.
This limited discovery opportunity meant visitors were missing complementary items and themed collections, reducing engagement with the full product range and limiting conversion opportunities during the critical holiday shopping season.
Our Solution 💡
We identified a key opportunity to enhance product discovery at the point where many users typically exit the page.
We implemented a visually compelling “The Very Best Gifts” section with:
- Five curated collection categories with clear navigation paths
- High-quality lifestyle imagery representing each collection
- Mobile-optimized carousel
- Themed “For Them — And You” messaging to encourage both gift shopping and self-purchase
Technical Implementation ⚡
The solution was built with responsive design techniques ensuring optimal appearance across all devices:
- Desktop: Multiple categories displayed simultaneously
- Mobile: Touch-friendly carousel with pagination dots
- Test parameters: All devices, all major browsers
- User segments: All traffic to New Arrivals pages (women’s and men’s)
The Results
| Metric | Control | Variation | Lift |
|---|---|---|---|
| Users | 64,691 | 63,566 | - |
| Transactions | 913 | 961 | - |
| Conversion Rate | 1.41% | 1.51% | 7.1% |
| Revenue Lift | - | - | 3.7% |
Why It Worked 🎯
Our solution succeeded by leveraging proven conversion principles that align perfectly with luxury shopping behaviors. By capturing user attention at natural exit points, we extended the browsing journey where engagement would typically end. The curated collections improved cross-sells, by boosting product discovery.
The dual-purpose messaging (“For Them — And You”) tapped into holiday shoppers’ gift-buying mindset while encouraging self-purchase—which resonated with the luxury audience looking for both thoughtful gifts and personal treats.
For premium apparel, a 1.41% base is right where you’d expect - our stats page shows what a normal conversion rate looks like for fashion ecommerce, and why a discovery section that recaptures exit traffic is worth building before peak season.
Let’s Talk 💬
Could your e-commerce site benefit from a smart approach to product discovery? Let’s discuss how our UX optimization can boost your conversion rates and increase revenue per user.
Appendix: Detailed test parameters and statistical analysis
Performance Metrics
| Parameter | Value |
|---|---|
| Device targeting | All devices (desktop, tablet, mobile) |
| Browser targeting | All major browsers |
| User segments | All traffic to New Arrivals pages (both women's and men's sections) |
| Page scope | Product listing pages for New Arrivals category |
| Test duration | 35 days |
| Sample size | 128,257 users total |
| Participation rate | 100% of New Arrivals page visitors |
Statistical Analysis
| Metric | Value |
|---|---|
| Confidence level | 93% |
| Z-score | 1.50 |
| P-value | 0.0669183 |
| Conservative lift estimate | 2% |
| Sample size | 128,257 users total |
| Test duration | 35 days |
| Participation rate | 100% of New Arrivals page visitors |