Collaboration Enhanced 207% eCommerce Conversion Rate
Graduation Regalia Brand
Last Updated: May 11, 2026 | Reviewed by Devon Cox, President, ConversionTeam
The Client
This company offers a full line of graduation regalia, ranging from pre-school to college, along with an array of graduation accessories.
Multi-touchpoint CRO programs compound on seasonal-demand catalogs like graduation regalia - 207% conversion lift over an iterative testing program. The level of program-driven work to expect from the leading ecommerce CRO agencies that operate the program rather than deliver one-off tests.
The Business Need
The company knew its site was not reaching its full potential and were already embarking on a complete in-house overhaul of the site. The “busy season” had just ended for the company and they knew they had 6 months to change the site for the better before the next busy season kicked off again. Selling graduation wear was also growing more competitive as their competition grew more savvy and new (copycat) merchants entered the space. For these reasons, it hired a conversion rate optimization company, Conversion Team.
Challenges
The internal team had just recently finalized a full redesign of the website to address the issues they they had already identified, so Conversion Team was entering into the project late, with so many decisions made and changes about to occur.
Solution
With the client so far along and engaged in the improvement process, it did not make sense for Conversion Team to undertake a separate effort to optimize the site. Instead, we exploited the flexibility of the Iterate program and resolved to collaborate with the client’s internal resources, augmenting existing efforts.
Augmenting Internal Resources
Conversion Team realized during the intake process that the client had excellent internal resources and that they could benefit from a new, fresh, and objective perspective. As a result, additional attention was paid to the analysis portion of the continuous improvement program, to gain new insights into the website, its visitor’s behaviors, and any obstacles visitors may be encountering that make them less likely to purchase.
Gaining insights required analysis involving Google Analytics, surveys and other user journey analysis tools that we placed on the site as part of our program.
Once we had these insights and felt we understood the website and its visitor's needs, we started reviewing the changes the internal team was proposing, to see if there was anything that could be further improved. From this, came our 1st set of recommendations.
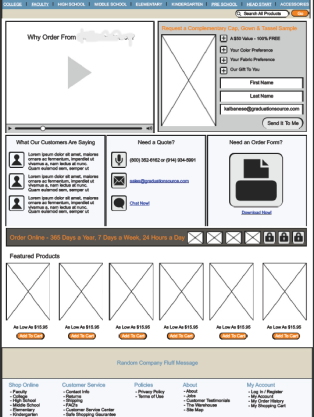
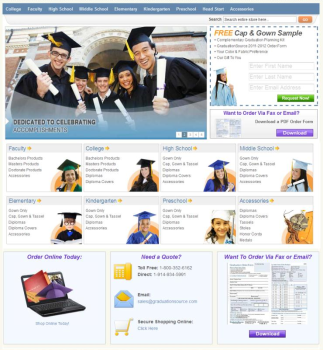
An example of collaboration is the homepage. The client’s internal team had drafted up a homepage wire-frame (see left) prior to Conversion Team being hired. Through the review, research and feedback on both sides, we arrived at a slightly revised homepage layout (see below). The revised layout brought up the product categories higher on the page and contained a few other subtle changes that are attributed to getting 15% more homepage arrivals further into the site. As a result, the new homepage participated in 260% more revenue than the previous version of the homepage.
Collaborative Cycle
The program turned into a collaborative effort with the internal team taking Conversion Team recommendations, providing feedback, brainstorming about the issues we identified and coming up with the best solution possible from all the available internal knowledge. Often we re-submitted optimizations from collaborative sessions, sometimes the next optimization was identified well.
Review & User Testing
Once the internal team had something ready for production, we would provide feedback. In the case where the website was undergoing a major revision, we performed additional User Testing to identify how prospective customers would respond to the new site changes, returning insights to the internal team to consider.
Optimizations & Changes
Within 2 months of starting a continuous improvement program, the client and Conversion Team had collaborated on and changed practically every page of the website including completely optimizing the eCommerce shopping cart and checkout system.
Results
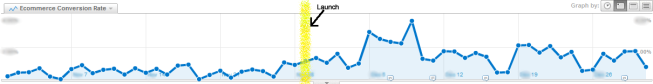
207% Conversion Rate Increase
The eCommerce conversion rate of the website increased 207% month over month (The previous year, it had decreased 12% during the same period, due to expected seasonality). The conversion rate for New Users to the site increased by 243% during this period.
Revenue per Visitor
The average value of a website visitor increased 149% month over month (The previous year, it had increased 10%). This reflected the increase in selling lower-priced products.
Bounce Rates
The number of visitors who came to the site without visiting beyond the page they arrived at (known as Bounce Rate) was reduced by 20%, indicating people took the site more seriously following the changes made.
* All statistics were pulled from Google Analytics, filtering out volatile and low quality traffic for a the period, and compared to the same date range a year later.