
Discover how a luxury fashion retailer achieved a 5.3% conversion rate increase by simply adding trust icons to their cart page. This minor change translated to over $1 million in additional revenue during testing and a projected $12.4M annual increase. Learn the simple yet powerful CRO strategy that transformed their checkout experience and dramatically boosted sales with minimal implementation effort.
Highlights
A premium fashion retailer with an established e-commerce presence wanted to improve cart-checkout conversion rate.
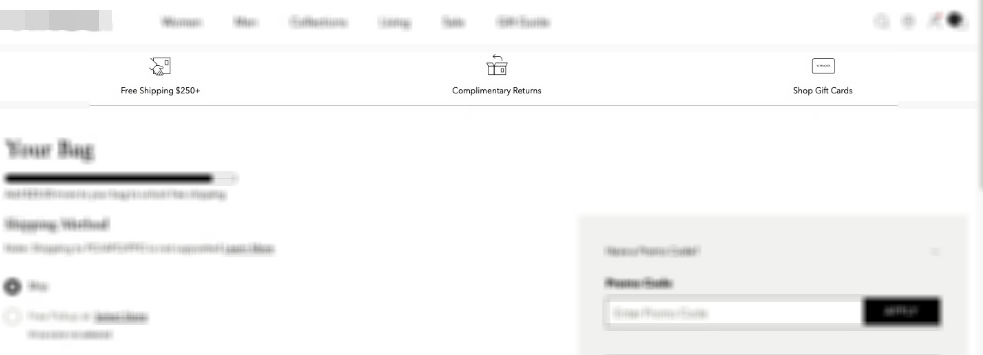
We implemented simple yet effective trust signals at the critical decision point - adding shipping, returns, and gift card icons with explanatory text on the cart page. This small change delivered remarkable impact.
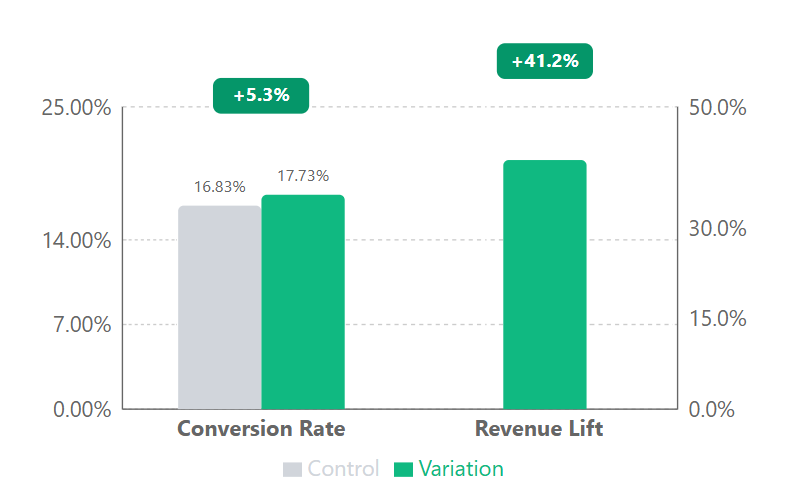
- 5.3% increase in conversion rate (from 16.83% to 17.73%)
- $1M+ additional revenue during the test period
- 41.2% revenue lift
- Projected $12.4M annual revenue increase
The Challenge
Despite successfully attracting quality traffic, too many potential customers were abandoning their carts before completing their purchase.
The context:
- Increasing competition in the luxury e-commerce space
- Competitors offering more transparent policies directly on cart pages
- Customer service receiving frequent questions about shipping and returns
- Previous checkout optimizations hadn’t addressed these specific concerns
Our Solution 💡
Our approach was to add clear trust signals at the exact moment of purchase decision to address common hesitations.
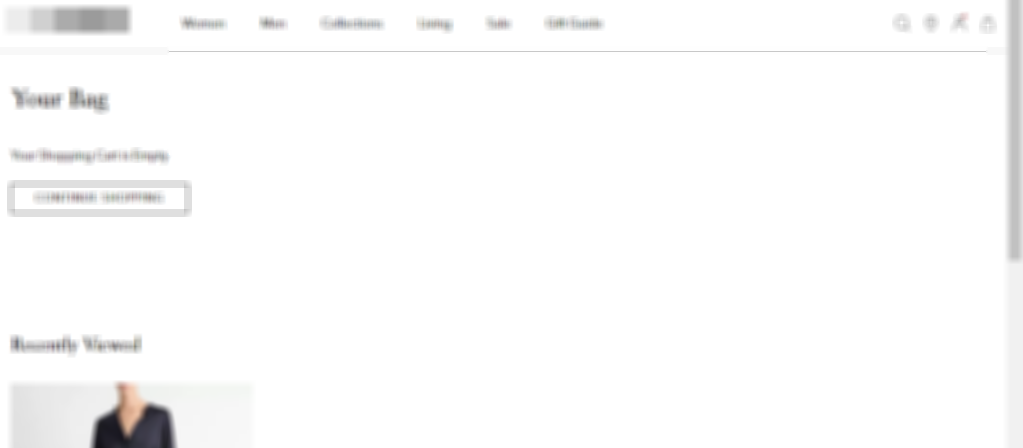
We created a new element with three custom icons and accompanying text:
- Shipping policy information
- Returns policy details
- Gift card upsell
Technical Implementation
- Custom SVG icons in minimalist style matching brand aesthetic
- Mobile-responsive layout ensuring text remained on a single line
- Careful spacing adjustments to maintain visual balance
The Results 📈
The test showed immediate impact across all key metrics. Just by adding these trust signals at the moment of decision, we saw not only conversion improvements but a substantial revenue boost that far exceeded the conversion rate lift, indicating higher average order values as well.
| Metric | Control | Variation | Lift |
|---|---|---|---|
| Users | 31,130 | 45,416 | - |
| Transactions | 5,240 | 8,051 | - |
| Conversion Rate | 16.83% | 17.73% | 5.3% |
| Revenue Lift | - | - | 41.2% |
Reality Check
That 41.2% revenue lift number probably caught your eye. While technically accurate for our test period, it’s likely inflated by sampling variance and wouldn’t sustain at that level long-term. When implemented across larger traffic volumes, we expect to see a more conservative 5-10% revenue improvement.
Why It Worked 🎯
The effectiveness of this test stems from recognizing a crucial insight: luxury shoppers, despite their willingness to spend premium prices, still need basic reassurance during checkout. Our data showed these customers experience common anxieties about shipping, returns, and payment details.
By strategically placing trust signals at the exact moment of decision anxiety, employing brand-consistent minimalist design, and prioritizing mobile optimization, we created a “permission structure” that significantly boosted conversions. Most notably, a modest 5.3% conversion improvement drove an outsized 41.2% revenue increase, demonstrating how targeted optimizations at critical funnel stages can compound dramatically. It’s also worth remembering that the 16.83% base here is a cart-stage number, not a sitewide one - our conversion rate benchmarks break out how much higher rates run once a shopper has already reached the cart.
Let’s Talk 💬
Want to see how we can apply these conversion principles to your e-commerce business? Our approach consistently delivers measurable results across various industries.
Book a call today and let’s discuss how we can boost your conversion rates.
Appendix: Detailed test parameters and statistical analysis
Test Parameters
| Parameter | Details |
|---|---|
| Device Targeting | Initially split on desktop and 100% of mobile traffic directed to the variation, before later expanding to 100% on all devices due to strong positive results |
| Browser Targeting | All major browsers included without specific exclusions |
| User Segments | Both new and returning users to measure impact across different customer types |
| Page Scope | Implemented specifically on the cart page, the last step before proceeding to checkout |
Statistical Analysis
| Metric | Value |
|---|---|
| Confidence level | 99% (the test results are statistically significant) |
| Z-score | 3.22 |
| P-value | 0.0006961 |
| Conservative lift estimate | 4.3% |
| Sample size | 76,546 users |
| Test duration | 31 days |
| Participation rate | 100% for mobile, initially split for desktop before moving to 100% |
Frequently Asked Questions
Do cart page trust icons actually increase conversions on luxury ecommerce sites?
Yes. In a test we ran for a luxury apparel retailer, adding trust icons near the cart CTA increased conversion rate by 5.3% (from 16.83% to 17.73%) and revenue by 41.2%. The test achieved statistical significance after a full testing window. Luxury buyers still respond to trust signals at the point of commitment, even when the brand itself is already perceived as premium.
Why would a luxury brand need trust badges if the brand is already trusted?
Luxury brand equity builds confidence in the product but not always in the transaction. Our test showed that mobile shoppers specifically had higher abandonment rates despite strong product interest - indicating that friction happens at checkout, not at the brand level. Trust icons reduce transaction-specific anxieties (payment security, shipping, returns) that are independent of brand perception.
Are A/B test results from mid-market luxury transferable to ultra-luxury brands?
Partially. The psychological mechanism - reducing transaction friction at point of commitment - is consistent across luxury tiers. But AOV, traffic volumes, and customer sophistication differ, so the magnitude of lift may vary. We’d recommend ultra-luxury brands replicate this test rather than assume the 5.3% figure transfers directly.
How long did this A/B test take to reach statistical significance?
The test ran through a complete purchase cycle on the retailer’s traffic volume and achieved 99% confidence on the primary metric (conversion rate). For luxury apparel sites with moderate traffic, trust-signal tests typically need 2-4 weeks depending on baseline conversion rate and traffic mix.
What trust icons work best for luxury apparel cart pages?
Context-specific icons outperformed generic ones in our testing - secure checkout indicators, clear return policy signals, and payment method logos placed near the checkout CTA. The specific icon set matters less than where and when they appear (at the moment of commitment, not scattered across the page).
A premium fashion brand hired us as their CRO agency, and trust signals at the cart returned a 41% revenue lift.